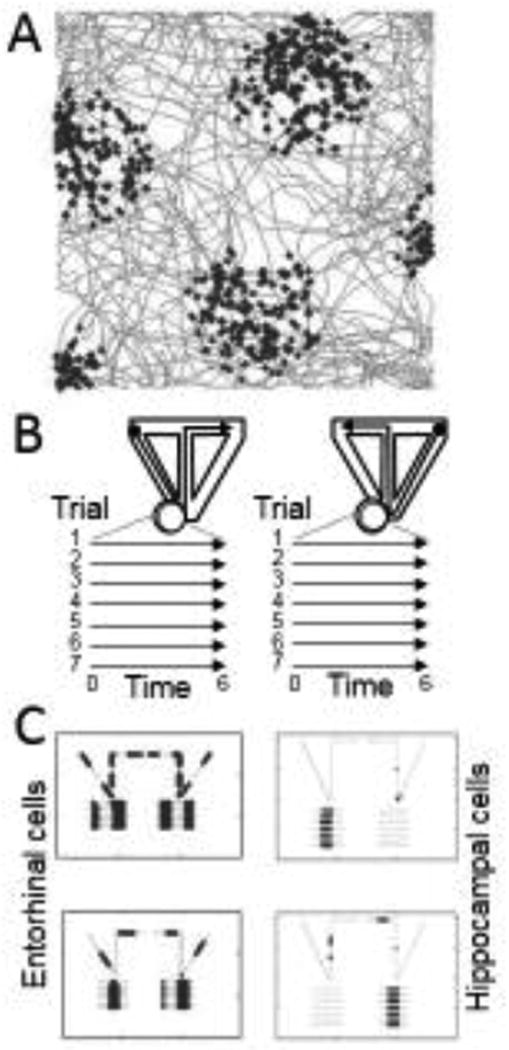
Figure 3.
Coding of space and time by the oscillatory interference model [29,60]. A. The model simulates grid cell firing as a simulated rat runs on a foraging trajectory (gray lines). Black dots show the location of the simulated rat each time the grid cell model generates a spike. B. The same model addresses activity during spatial alternation on a T-maze (top) with a period of running on a running wheel during the delay period between choices (lines on bottom). C. The same model shows location dependent firing on the T-maze (dark segments in top plot) as well as consistent firing at specific intervals of time or distance during running on the running wheel (dark segments on bottom lines).

