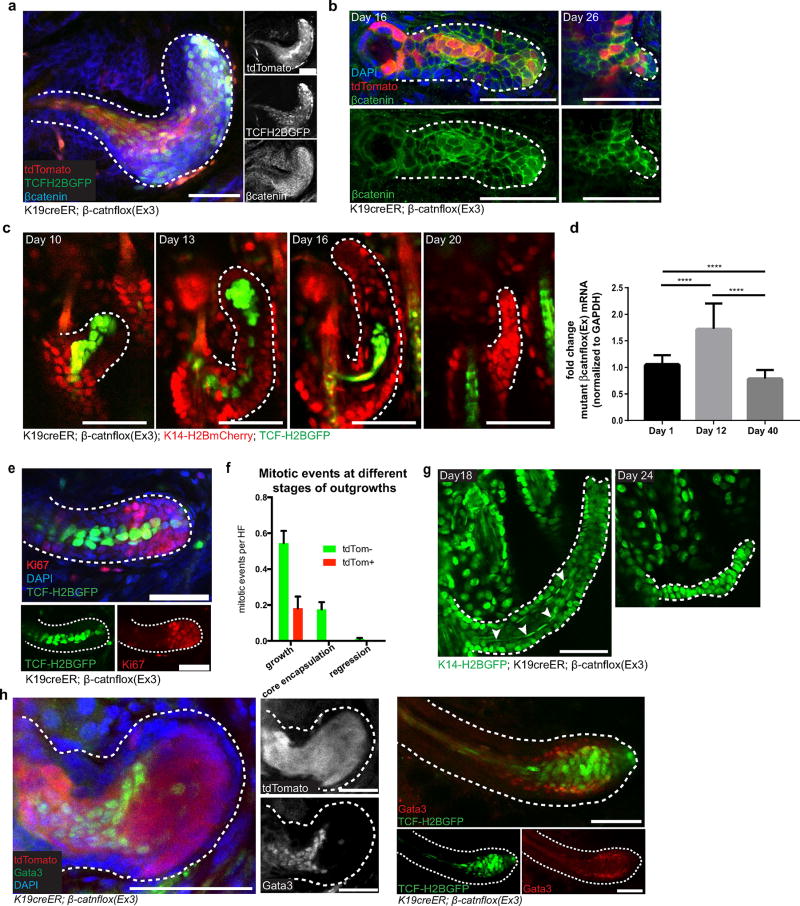
Extended Data Figure 4. Mutant β-catenin cells differentiate and are subsequently lost from the tissue.
a, Whole-mount β-catenin immunofluorescence staining (blue) showing increased nuclear β-catenin staining corresponds to the Cre and Wnt fluorescent reporters. b, β-Catenin whole-mounts. tdTom+ cells (red) along the core of the outgrowth express higher levels of β-catenin (green). c, Revisits of the same outgrowth, showing the progressive elimination of the mutant core (TCF–H2BGFP, green). Epithelial nuclei are labelled with K14–H2BmCherry (red). d, Reverse transcribed PCR quantification of mRNA expression of the floxed mutant β-cateninΔex3 allele, normalized to GAPDH, during the development and regression of outgrowths (mean ± s.e.m., n = 3 mice per time point, ****P < 0.0001). e, Whole-mount Ki67 staining. f, Mitotic events in tdTomato negative (tdTom−) and positive (tdTom+) cells, during different outgrowth stages (mean ± s.e.m., n = 150 outgrowths across three mice). g, Revisit of a single outgrowth showing the morphologically differentiated core (arrowheads, left) that is expelled from the tissue over time (right). h, Whole-mount staining of inner root sheath differentiation marker Gata3 (ref. 35) co-localizes with mutant core labelled with tdTomato (left) and TCFH2BGFP (right). Scale bars, 50 µm.

