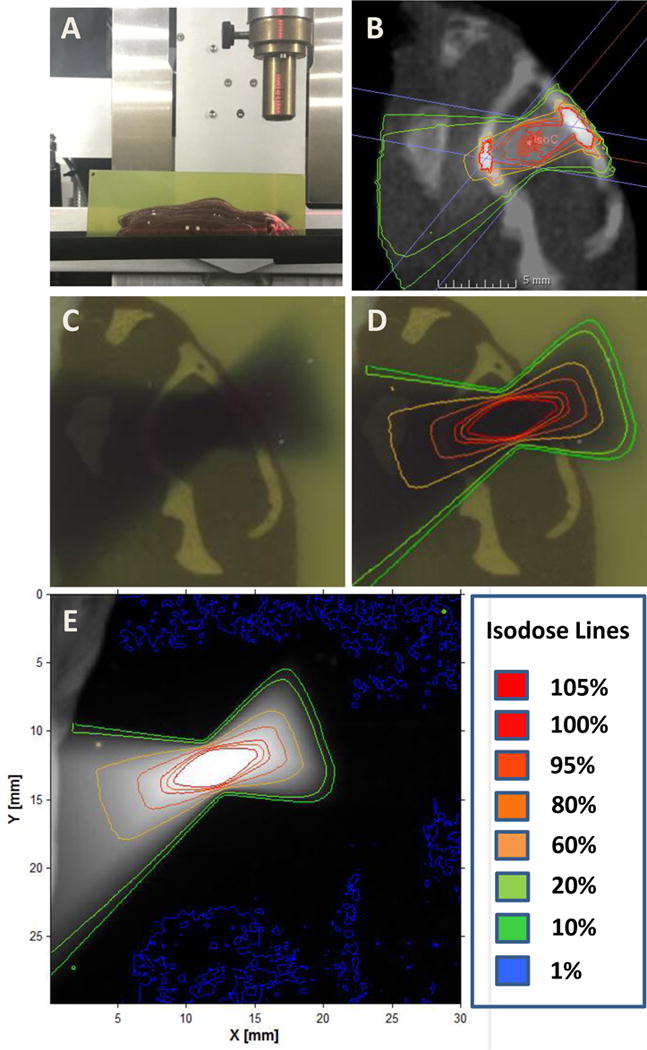
Figure 4.

Sagittal mouse-like phantom based radiochromic film analysis. A. The sagittal phantom was used with radiochromic film placed in the approximate level of the tumor. B. Isodose lines from a single sagittal arc plan. CT-simulation was performed on the phantom and a representative mouse MRI T1-post contrast scan was used to contour the GTV. A single sagittal arc was created targeting the GTV. C. Radiochromic film after radiation delivery. D. Isodose lines generated from the radiochromic film were overlaid onto Figure C. E. Isodose lines were created based on the inverse intensity projected on the radiochromic film.
