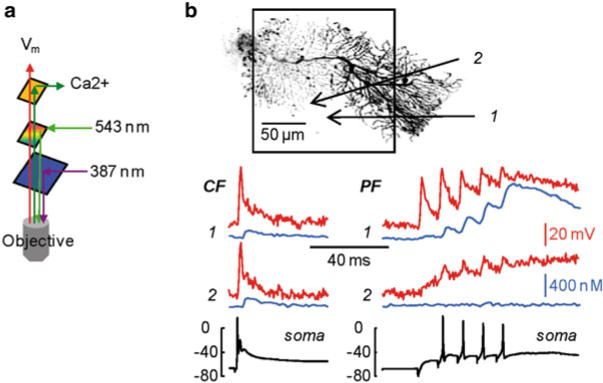
Fig. 4.5.

Simultaneous Vm and Ca2+ imaging. (a) Schematic of the optical configuration to achieve simultaneous Vm and Ca2+ imaging; 543 and 387 nm are used for voltage sensitive dye and Fura indicator excitations respectively; low green and red emissions of the two indicators are separated and detected with two cameras. (b) ( Top) Reconstruction of a cerebellar Purkinje neuron with the dendritic area in recording position outlined; two sites of interest ( 1 and 2) are indicated by the arrows. ( Bottom) ΔVm ( red traces) and Δ[Ca2+]i ( blue traces) signals associated with a climbing EPSP ( left) or with a train of five parallel fibre EPSPs at 100 Hz ( right) from the two sites of interest; somatic electrical recordings shown below. Modified from Vogt et al. 2011a
