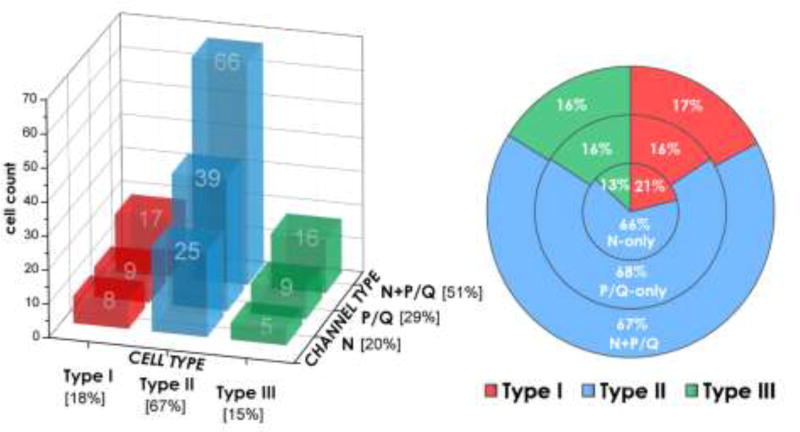
Figure 1. Distribution of PPN neurons according to electrophysiological type (I, II, or III) and high threshold calcium channel type (N+P/Q, N only, P/Q only).
Left side. Graph of the distribution of cells by cell type (Type I red, Type II blue, Type III green columns) and by channel type (N only, P/Q only, N+P/Q). Note that the numbers in each column are cell counts of recorded cells, and the percentage of cell type or channel type are in brackets in the axis legends. Right side. Pie chart of the percentage of cells by cell type and channel type. Note that the numbers inside the chart represent percent, not cell counts. Basically, the sample of almost 200 PPN cells shows that all cell types manifest all three types of channel expression. Since Type I cells are non-cholinergic, Type II cells are 2/3 cholinergic, and Type III cells are 1/3 cholinergic, it is highly likely that all three transmitter types (cholinergic, glutamatergic, and GABAergic) manifest all three channel types.

