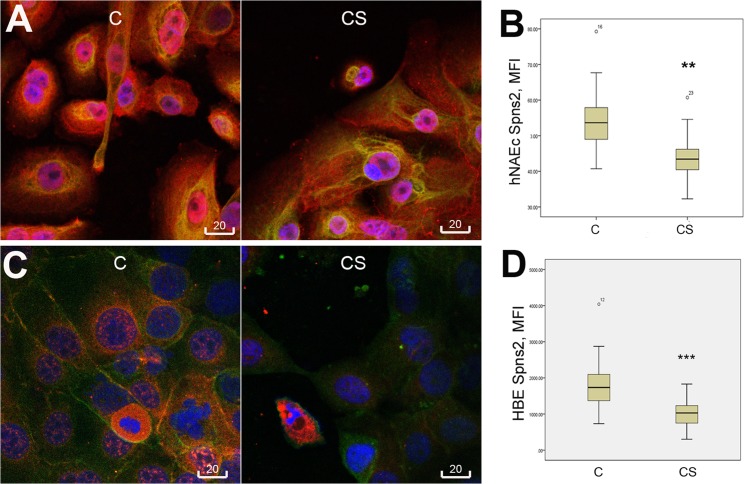
Fig 3. Cigarette smoke extract induced decrease of Spns2 expression in epithelial cells.
A, Representative confocal images of Spns2 in primary cultures of human nasal epithelial cells (hNAEc), cigarette smoke extract-treated (CS) vs. control (C). B, Measurement of Spns2 mean fluorescence intensity (MFI) in hNAEc; **, p = 0.001 significant reduction in CS-treated cells, data pooled from 2 experiments. C, Representative confocal images of Spns2 in 16HBE cell line, treated with CS vs. control. D, Measurement of Spns2 mean fluorescence intensity (MFI) in 16HBE cells; ***, p<0.001 significant reduction in CS-treated cells, data pooled from 2 experiments. Red: Spns2; Green: cyto-keratin (epithelial-specific marker) in A, and β-actin in C. Scale bar = 20μm.

