
Fig 2. Tree representation of reassortment.
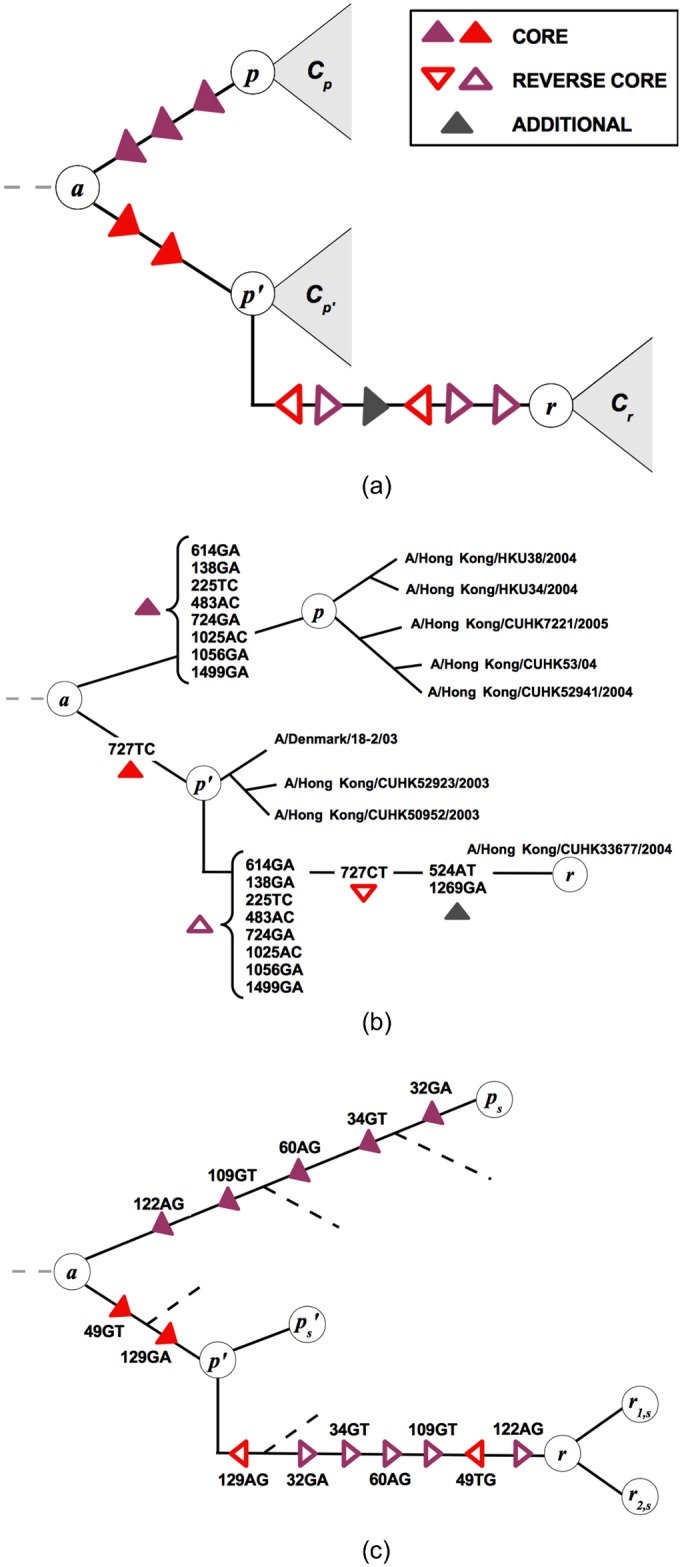
(a) Representation of reassortment in a two-segment genealogical tree. The parent strains p and p′ are in different sublineages of the tree; the reassortant strain r appears as a descendant of one of these parents (here p′; there is an equivalent tree in which r appears as a descendant of p). The strains p, p′, and r are the focal nodes of the clades Cp, Cp′, and Cr, respectively (grey areas). We identify the reassortment event by its set of core mutations, , which appear on the segment that r inherits from p and generate the genetic distance between the parent strains in that segment. The core mutations appear on the branches between the nodes p and p′ (filled red triangles: mutations between p and the last common ancestor a, filled purple triangles: mutations between a and p′). Their reverse mutations appear on the branch between p′ and r (empty red and purple triangles), which can also contain additional mutations (grey triangles). (b) A true event (nr 1 in S2 Table) detected by our algorithm on the joint HA-NA tree. Each mutation on HA segment is labeled with a number between 1 and 1701 that indicates the site. The pattern of repeated and reversed mutations (filled and empty triangles) follows the scheme in Fig. 2a: the reassortant strain A/Hong Kong/CUHK33677/2004 is generated by an event with δ = 9 between p and p′ clades. (c) The result of a simulated reassortment event on the reconstructed genealogical tree, correctly detected by the algorithm. The internal node r is inferred as the reassortant ancestor of r1/2,s, i.e. the strains evolved from the sequence that was actually generated by reassortment between ps and .