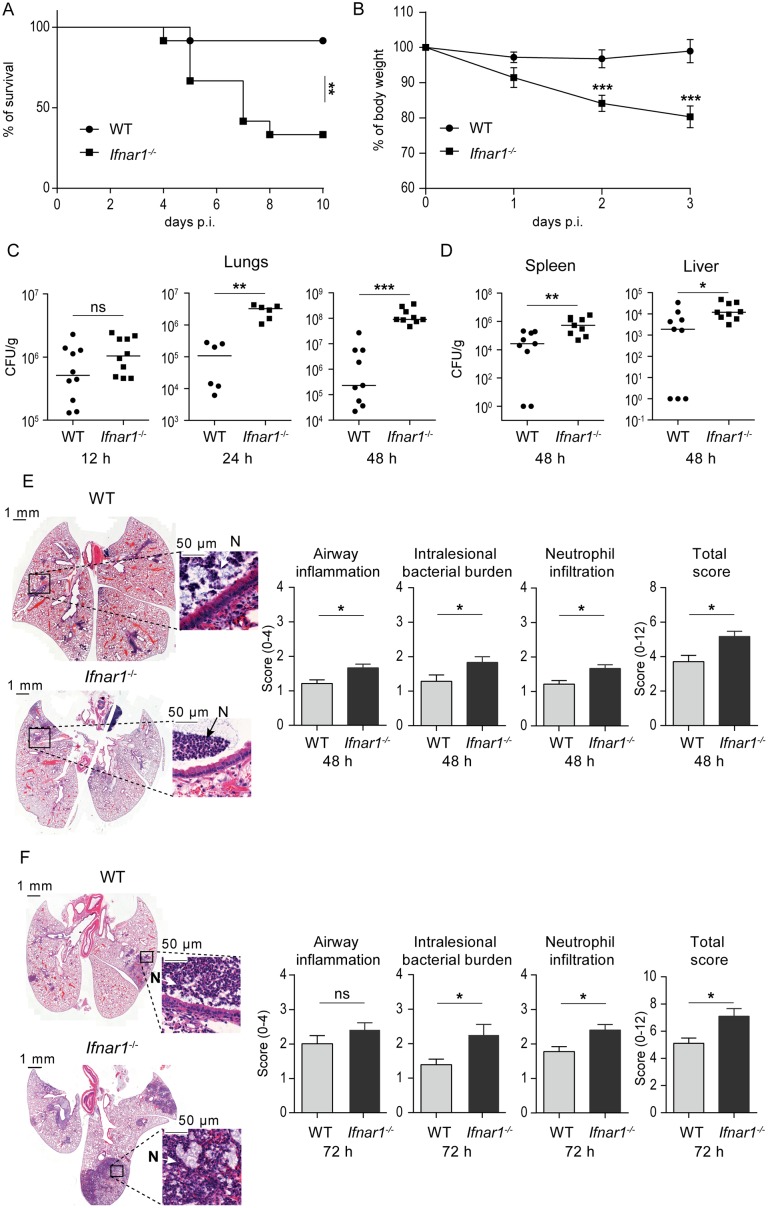
Fig 1. Type I IFN signaling protects against K. pneumoniae lung infection by controlling bacterial growth and lung pathology.
(A) WT and Ifnar1-/- mice (n = 12 per genotype) were infected intranasally (5 x 10⁴ CFU of K. pneumoniae), and survival was monitored for 10 days. Kaplan-Meier survival curves are shown. Statistical evaluation: Log-rank (Mantel-Cox) test. **, P < 0.01. (B) Weight changes during the first 3 days following infection. Data are represented as mean ± SEM. Statistical evaluation: unpaired Student’s t test. ***, P < 0.001. (C, D) WT and Ifnar1-/- mice were infected as in (A) and bacterial loads were determined in lungs 12, 24 and 48 h p. i. (C), and in spleens and livers 48 h p. i. (D). Bacterial load is presented as CFU per g of analyzed organ per infected animal. Dot plots: horizontal bars represent median. Statistical evaluation: Mann-Whitney test. *, P < 0.05; **, P < 0.01; ***, P < 0.001; ns, not significant. (E, F) H&E-stained sections of lungs of infected WT and Ifnar1-/- animals at 48 (E) and 72 h (F) p. i., together with quantification of airway inflammation, intralesional bacterial burden, neutrophilic infiltration and the combined histopathology analysis (total histopathology score) (n = 7, 6, 9 and 10 mice for WT 48 h p. i., Ifnar1-/- 48 h p. i., WT 72 h p. i., Ifnar1-/- 72 h p. i., respectively). Insets: Arrows and N indicate neutrophils. Note an increased airway inflammation, intralesional bacterial burden and neutrophilic infiltration in lungs from Ifnar1-/- animals. Histopathology scores were determined by blinded scoring; error bars, mean ± SEM. Statistical evaluation: Mann-Whitney test. *, P < 0.05; ns, not significant.

