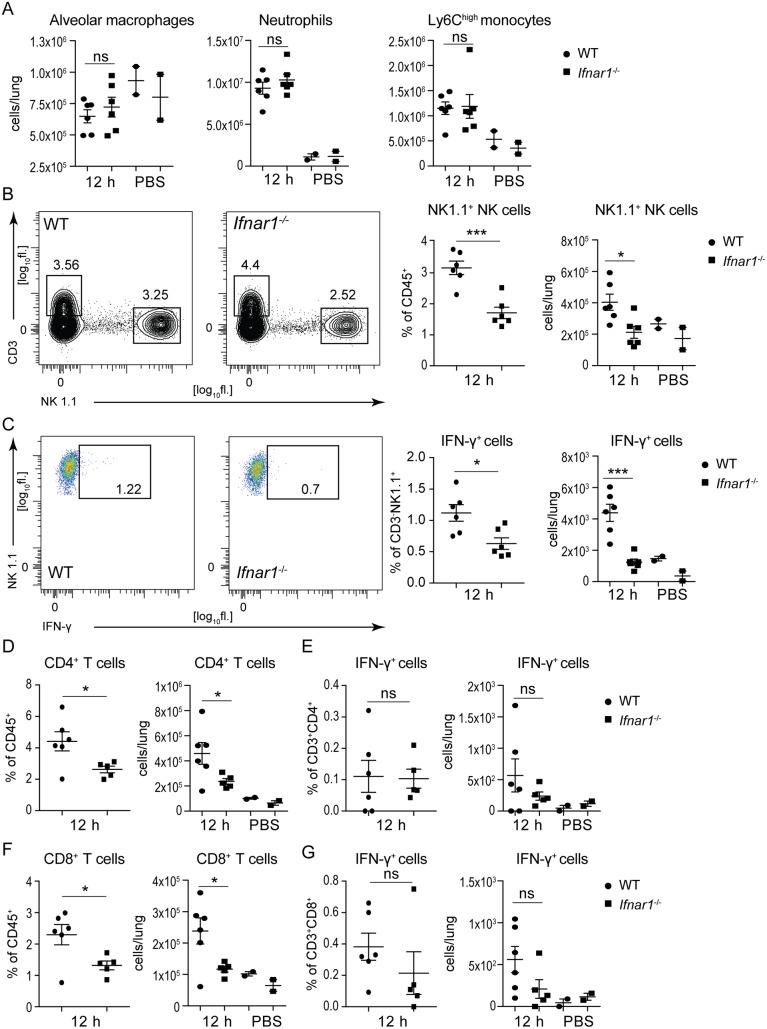
Fig 4. Type I IFN signaling induces NK cell accumulation and activation in lungs during K. pneumoniae infection.
WT and Ifnar1-/- mice were infected intranasally (5 x 10⁴ CFU of K. pneumoniae) for 12 h or treated with PBS and immune cell subsets in lungs were analyzed by flow cytometry. Cells were subgated for CD45+ cells. (A) Alveolar macrophage, neutrophil and inflammatory monocyte populations were detected as SiglecF+CD11chigh, Cd11b+Ly6G+Ly6Cmed, and CD11b+Ly6G-Ly6Chigh, respectively. Populations are presented as total cells per lung calculated from percentages of individual subsets (shown in S4 Fig). (B, C) NK cells, detected as CD3-NK1.1+, and IFN-γ+ NK cells are shown. Representative plots of NK cells (B, left panels) and IFN-γ+ NK cells (C, left panels) are shown. Numbers indicate percentages in the outlined area of live, CD45+ cells. NK cell population in dot plots is shown both as percent of CD45+ cells as well as total cells per lung (B, right panels). IFN-γ+ cells are shown both as % of CD3-NK1.1+ cells and as total cells per lung (C, right panels). (D-G) CD4 T cells detected as CD3+CD4+ (D), IFN-γ-producing CD4 T cells detected as IFN-γ+ CD3+CD4+ (E), CD8 T cells detected as CD3+CD8+ (F), and IFN-γ-producing CD8 T cells detected as IFN-γ+ CD3+CD8+ (G) are shown in dot plots. CD4 and CD8 T cells are shown as percent of CD45+ cells (D and F, left panels) and as total cells per lung (D and F, right panels). IFN-γ+ CD4 and IFN-γ+ CD8 T cells are shown both as % of CD3+CD8+ cells (E and G, left panels) and as total cells per lung (E and G, right panels). Statistical evaluation: unpaired Student’s t test; error bars, mean ± SEM (n > 3); *, P < 0.05; **, P < 0.01; ***, P < 0.001; ns, not significant.

