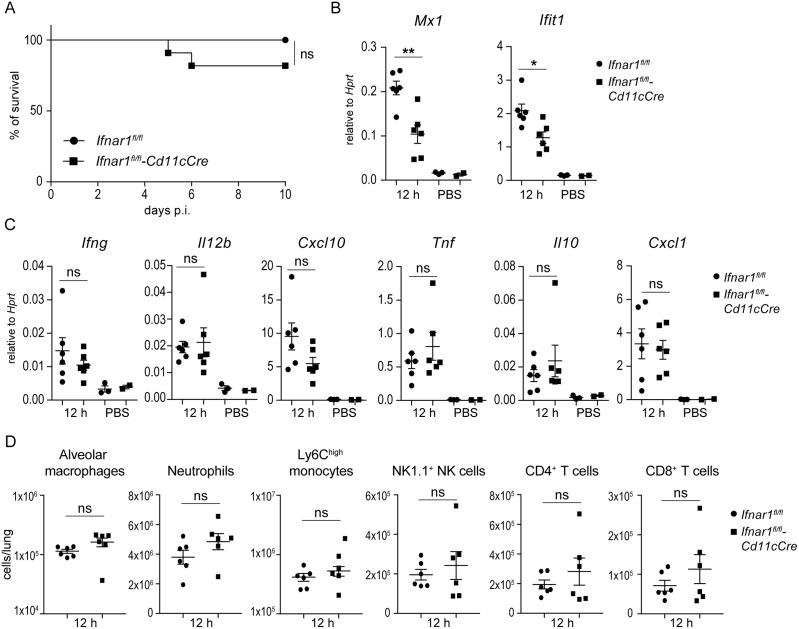
Fig 6. Protective responses against K. pneumoniae infection develop independently of type I IFN signaling in alveolar macrophages.
(A) Ifnar1fl/fl-CD11cCre and Ifnar1fl/fl mice (n = 11 and 10, respectively) were infected intranasally (5 x 10⁴ CFU of K. pneumoniae), and survival was monitored for 10 days. Kaplan-Meier survival curves are shown. Statistical evaluation: Log-rank (Mantel-Cox) test; ns, not significant. (B, C) Ifnar1fl/fl-CD11cCre and Ifnar1fl/fl mice (n = 6 per genotype) were infected intranasally (5 x 10⁴ CFU of K. pneumoniae) or treated with PBS (n = 2 and 3, respectively) for 12 h. Expression of Mx1 and Ifit1 (B), and Ifng, Il12b, Cxcl10, Tnf, Il10 and Cxcl1 (B) in lungs was determined by qPCR (normalization to Hprt). Statistical evaluation: unpaired Student’s t test; error bars, mean ± SEM (n > 3); *, P < 0.05; **, P < 0.01; ns, not significant. (D) Ifnar1fl/fl-CD11cCre and Ifnar1fl/fl mice (n = 6 per genotype) were infected intranasally (5 x 10⁴ CFU of K. pneumoniae) for 12 h or treated with PBS and immune cell subsets in lungs were analyzed by flow cytometry as in Fig 4. Populations are presented as total cells per lung calculated from percentages of individual immune cell subsets (shown in S5 Fig). Statistical evaluation: unpaired Student’s t test; error bars, mean ± SEM; ns, not significant.

