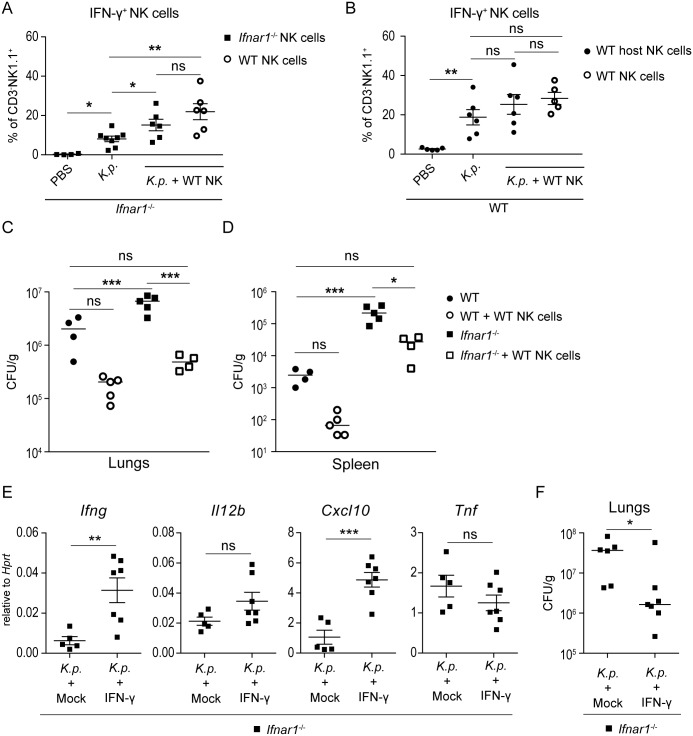
Fig 7. Transfer of WT NK cells or administration of IFN-γ restore control of K. pneumoniae growth in Ifnar1-/- mice.
(A) Ifnar1-/- mice were treated with PBS, infected intranasally (5 x 10⁴ CFU of K. pneumoniae) (K.p.), or given 1 x 10⁶ WT NK cells and infected intranasally (5 x 10⁴ CFU of K. pneumoniae) (K.p. + WT NK). Lungs were analyzed 24 h p.i. by flow cytometry for IFN-γ-producing endogenous Ifnar1-/- NK cells (dot plot groups 1–3) and exogenous WT NK cells (dot plot group 4) shown as percent of IFN-γ+ in CD3-NK1.1+ cells. Statistical evaluation: dots represent individual mice; error bars, mean ± SEM; unpaired Student’s t test; *, P < 0.05; **, P < 0.01; ns, not significant. (B) WT mice were treated with PBS, infected intranasally (5 x 10⁴ CFU of K. pneumoniae) (K.p.), or given 1 x 10⁶ WT NK cells and infected intranasally (5 x 10⁴ CFU of K. pneumoniae) (K.p. + WT NK). Lungs were analyzed 24 h p.i. by flow cytometry for IFN-γ-producing endogenous WT NK cells (dot plot groups 1–3) and exogenous WT NK cells (dot plot group 4) shown as percent of IFN-γ+ in CD3-NK1.1+ cells. Statistical evaluation: dots represent individual mice; unpaired Student’s t test; **, P < 0.01; ns, not significant. (C, D) Bacterial loads in lungs (C) and spleen (D) of infected WT and Ifnar1-/- mice which received WT NK cells or were mock-treated. Data show CFU per g of lung per infected animal. Dots in dot plots represent individual mice. Statistical evaluation: one-way ANOVA with multiple comparisons; *, P < 0.05; ***, P < 0.001; ns, not significant. (E, F) Ifnar1-/- mice infected intranasally (5 x 10⁴ CFU of K. pneumoniae) and given IFN-γ or PBS (mock) at the time of infection. Mice were euthanized 24 h p.i. and mRNA expression (Ifng, Il12, Cxcl10, Tnf) (E) and bacterial loads (F) in lungs were determined by qPCR and CFU assays, respectively. Statistical evaluation in (E) (n = 5, mock; n = 7, IFN-γ): unpaired Student’s t test; error bars, mean ± SEM; **, P < 0.01; ***, P < 0.001; ns, not significant. Statistical evaluation (F) (n = 6, mock; n = 7, IFN-γ): Mann-Whitney test; *, P < 0.05.

