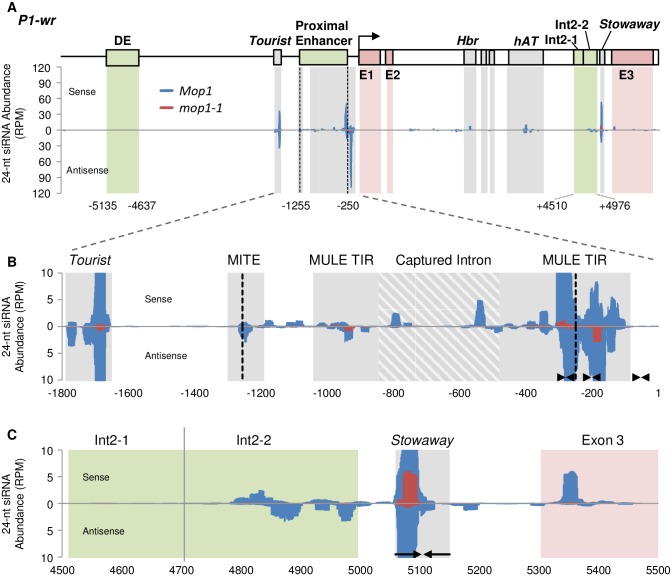
Fig 2. 24-nt siRNA abundance at the P1-wr gene.
(A) Line diagram of P1-wr showing gene structure and different regulatory elements (see Fig 1 legend for details). Abundance of 24-nt siRNA was shown on sense and antisense strands from P1-wr;Mop1/mop1-1 (3 plants) and P1-wr;mop1-1/mop1-1 (2 plants) samples as reads per million (RPM) and normalized to the 22-nt size class (see Methods). Green, grey, and red shaded areas indicate regulatory regions, TEs, and exons, respectively. Proximal enhancer is shown as region between black dashed lines. (B) Repetitive elements and 24-nt siRNA abundance in the proximal enhancer region. (C) 24-nt siRNA abundance in the Int2-1, Int2-2, and downstream regions. siRNA abundances from P1-wr;Mop1 samples (blue) and from P1-wr;mop1-1 (red) are shown. Coordinates for each graph are shown below. Black arrows indicate inverted repeats.

