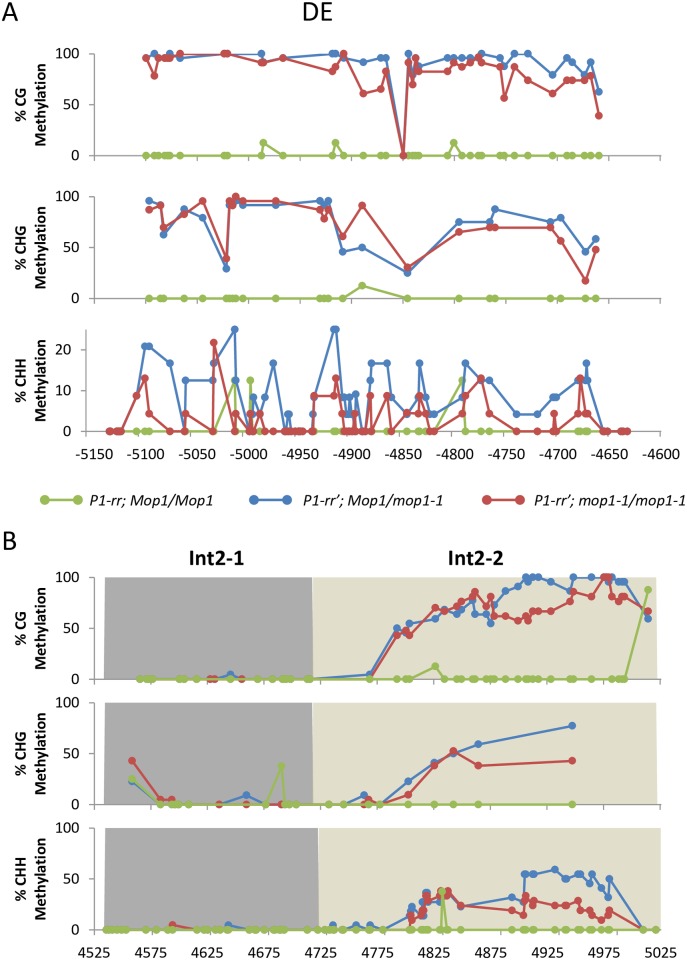
Fig 4. DNA methylation of individual cytosine sites of native and paramutagenic P1-rralleles in Mop1 and mop1-1 background.
Bisulfite sequencing results for individual cytosine sites in the (A) DE region and (B) Int2-1 (dark grey) and Int2-2 (light grey) regions. Each site is indicated by a circle. P1-rr; Mop1/Mop1, P1-rr’; Mop1/mop1-1, and P1-rr’; mop1-1/mop1-1 are green, blue, and red, respectively. Data are the mean of two biological replicates (except P1-rr which is one plant).

