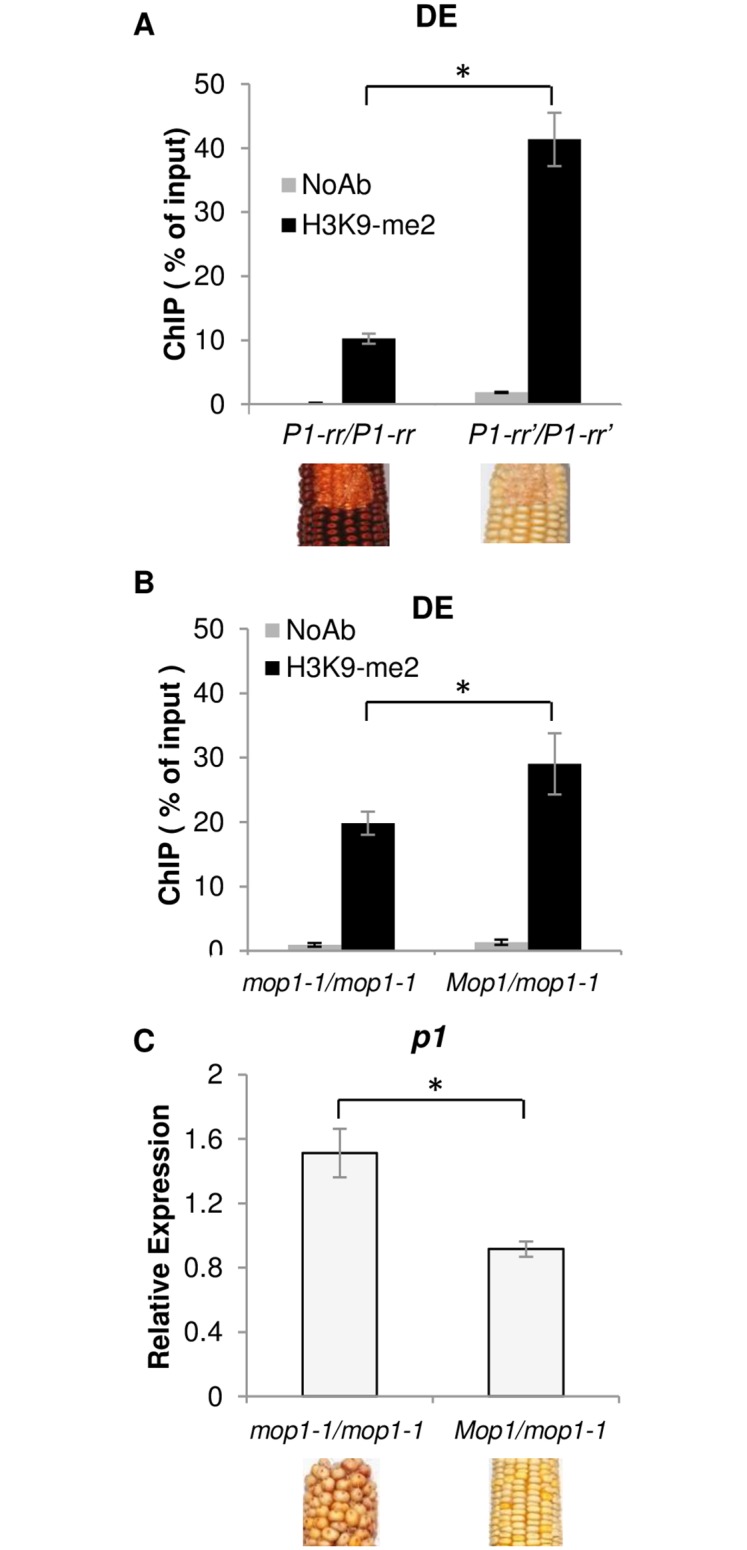
Fig 5. H3K9me2 and transcript analysis at P1-rr’ in Mop1 and mop1-1.

(A) ChIP-qPCR of H3K9me2 of the DE region of P1-rr and P1-rr’ plants. (B) ChIP-qPCR of H3K9me2 of the DE region of P1-rr’ plants in Mop1 or mop1-1 plants and (C) their corresponding p1 expression from qRT-PCR. Ears are shown for the corresponding phenotypes in which the pericarp samples were used for ChIP experiments. Data are presented as the mean of three biological replicates with error bars indicating SE of the mean. * P<0.05 using an unpaired t-test.
