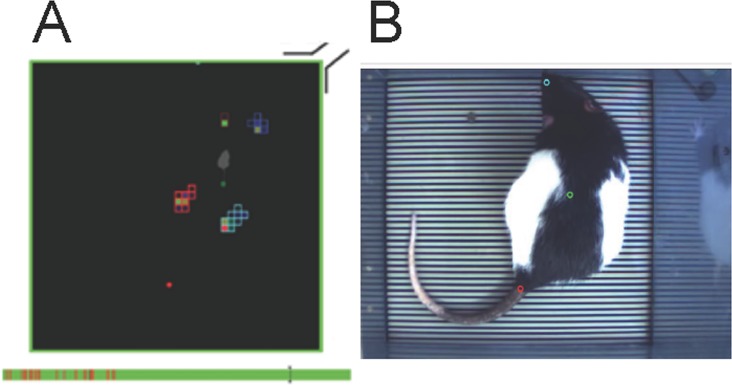
Fig 3. Illustration of the monitoring set up in condition of acquisition.
A: a colour is assigned to each area of contact between the animal body and the force sensors. The coloured bar below represents the acquisition time (here 5min). The green corresponds to the time analysed, the red to the non-analysable segments. The grey attachment is a visual marker (representing the electrical connection with the interface) that allows juxtaposition of both the digitized false colour image and the picture of the rat. The grey bar is the cursor of the analysed image. B: Picture taken from the video tracking of the analysed animal.

