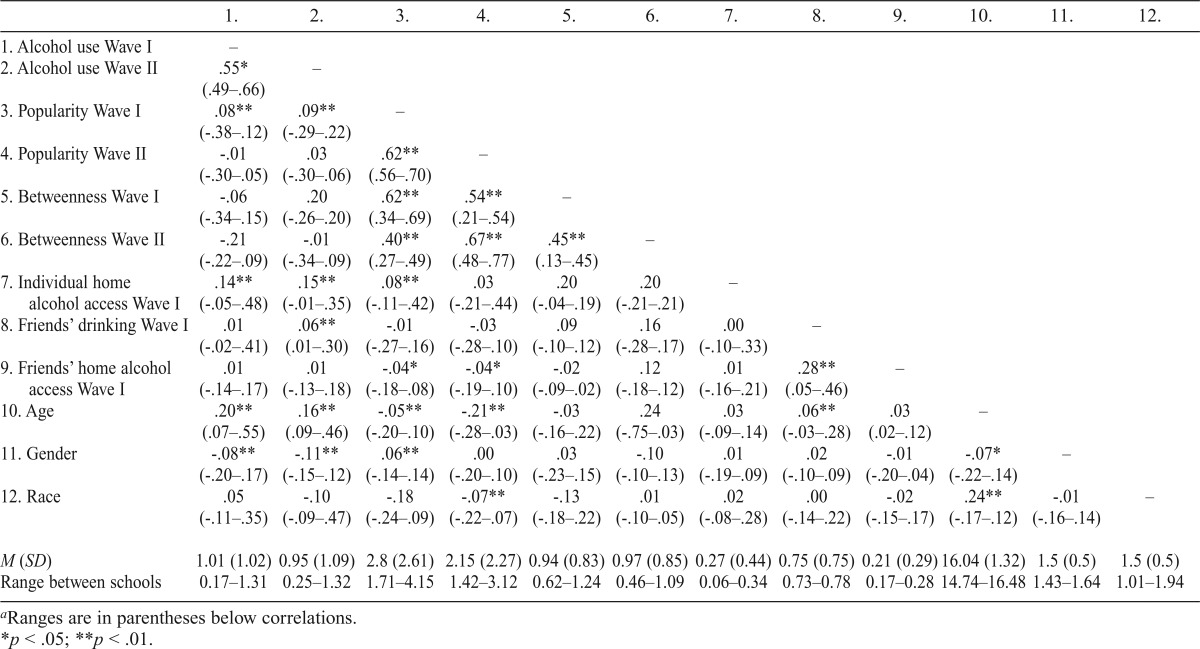
Table 1.
Correlationsa and means for all variables
| 1. | 2. | 3. | 4. | 5. | 6. | 7. | 8. | 9. | 10. | 11. | 12. | |
| 1. Alcohol use Wave I | – | |||||||||||
| 2. Alcohol use Wave II | .55* | – | ||||||||||
| (.49–.66) | ||||||||||||
| 3. Popularity Wave I | .08** | .09** | – | |||||||||
| (-.38–.12) | (-.29–.22) | |||||||||||
| 4. Popularity Wave II | -.01 | .03 | .62** | – | ||||||||
| (-.30–.05) | (-.30–.06) | (.56–.70) | ||||||||||
| 5. Betweenness Wave I | -.06 | .20 | .62** | .54** | – | |||||||
| (-.34–.15) | (-.26–.20) | (.34–.69) | (.21–.54) | |||||||||
| 6. Betweenness Wave II | -.21 | -.01 | .40** | .67** | .45** | – | ||||||
| (-.22–.09) | (-.34–.09) | (.27–.49) | (.48–.77) | (.13–.45) | ||||||||
| 7. Individual home alcohol access Wave I | .14** | .15** | .08** | .03 | .20 | .20 | – | |||||
| (-.05–.48) | (-.01–.35) | (-.11–.42) | (-.21–.44) | (-.04–.19) | (-.21–.21) | |||||||
| 8. Friends’ drinking Wave I | .01 | .06** | -.01 | -.03 | .09 | .16 | .00 | – | ||||
| (-.02–.41) | (.01–.30) | (-.27–.16) | (-.28–.10) | (-.10–.12) | (-.28–.17) | (-.10–.33) | ||||||
| 9. Friends’ home alcohol access Wave I | .01 | .01 | -.04* | -.04* | -.02 | .12 | .01 | .28** | – | |||
| (-.14–.17) | (-.13–.18) | (-.18–.08) | (-.19–.10) | (-.09–.02) | (-.18–.12) | (-.16–.21) | (.05–.46) | |||||
| 10. Age | .20** | .16** | -.05** | -.21** | -.03 | .24 | .03 | .06** | .03 | – | ||
| (.07–.55) | (.09–.46) | (-.20–.10) | (-.28–.03) | (-.16–.22) | (-.75–.03) | (-.09–.14) | (-.03–.28) | (.02–.12) | ||||
| 11. Gender | -.08** | -.11** | .06** | .00 | .03 | -.10 | .01 | .02 | -.01 | -.07* | – | |
| (-.20–.17) | (-.15–.12) | (-.14–.14) | (-.20–.10) | (-.23–.15) | (-.10–.13) | (-.19–.09) | (-.10–.09) | (-.20–.04) | (-.22–.14) | |||
| 12. Race | .05 | -.10 | -.18 | -.07** | -.13 | .01 | .02 | .00 | -.02 | .24** | -.01 | – |
| (-.11–.35) | (-.09–.47) | (-.24–.09) | (-.22–.07) | (-.18–.22) | (-.10–.05) | (-.08–.28) | (-.14–.22) | (-.15–.17) | (-.17–.12) | (-.16–.14) | ||
| M (SD) | 1.01 (1.02) | 0.95 (1.09) | 2.8 (2.61) | 2.15 (2.27) | 0.94 (0.83) | 0.97 (0.85) | 0.27 (0.44) | 0.75 (0.75) | 0.21 (0.29) | 16.04 (1.32) | 1.5 (0.5) | 1.5 (0.5) |
| Range between schools | 0.17–1.31 | 0.25–1.32 | 1.71–4.15 | 1.42–3.12 | 0.62–1.24 | 0.46–1.09 | 0.06–0.34 | 0.73–0.78 | 0.17–0.28 | 14.74–16.48 | 1.43–1.64 | 1.01–1.94 |
Ranges are in parentheses below correlations.
p < .05;
p < .01.

