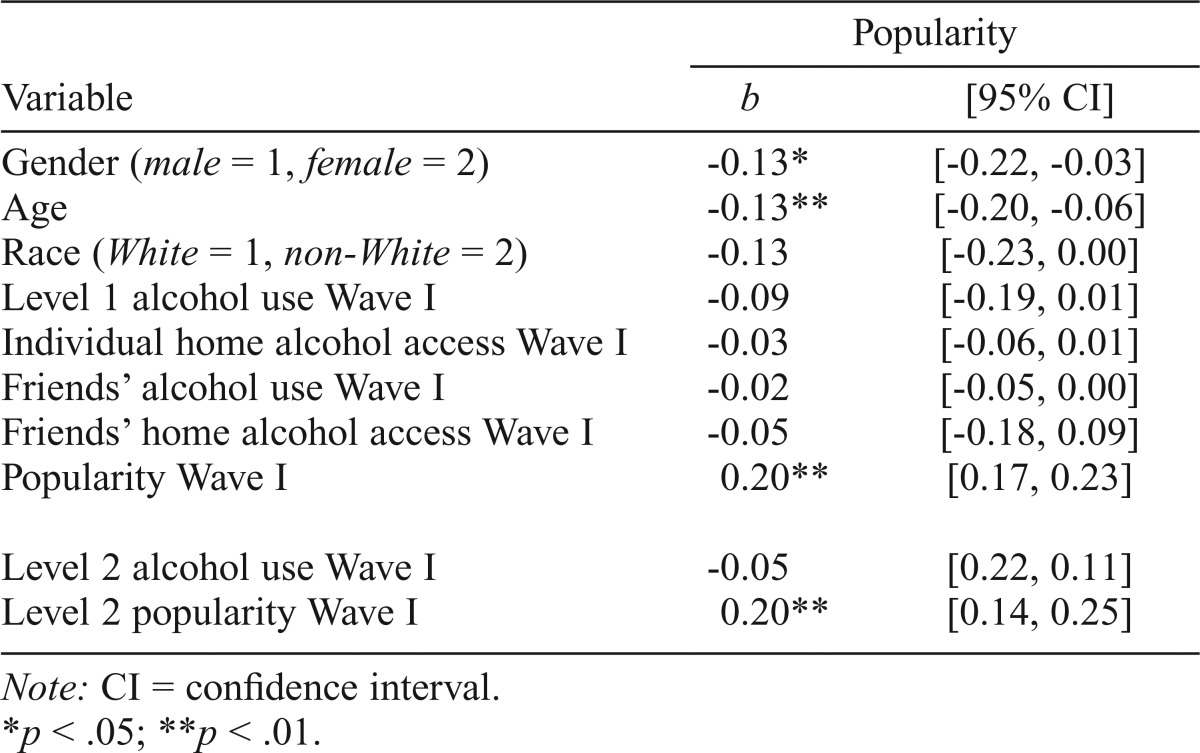
Table 3.
Unstandardized regression coefficients and 95% confidence intervals for negative binomial regression model predicting Wave II popularity
| Popularity |
||
| Variable | b | [95% CI] |
| Gender (male = 1, female = 2) | -0.13* | [-0.22, -0.03] |
| Age | -0.13** | [-0.20, -0.06] |
| Race (White = 1, non-White = 2) | -0.13 | [-0.23, 0.00] |
| Level 1 alcohol use Wave I | -0.09 | [-0.19, 0.01] |
| Individual home alcohol access Wave I | -0.03 | [-0.06, 0.01] |
| Friends’ alcohol use Wave I | -0.02 | [-0.05, 0.00] |
| Friends’ home alcohol access Wave I | -0.05 | [-0.18, 0.09] |
| Popularity Wave I | 0.20** | [0.17, 0.23] |
| Level 2 alcohol use Wave I | -0.05 | [0.22, 0.11] |
| Level 2 popularity Wave I | 0.20** | [0.14, 0.25] |
Note: CI = confidence interval.
p <.05;
p <.01.

