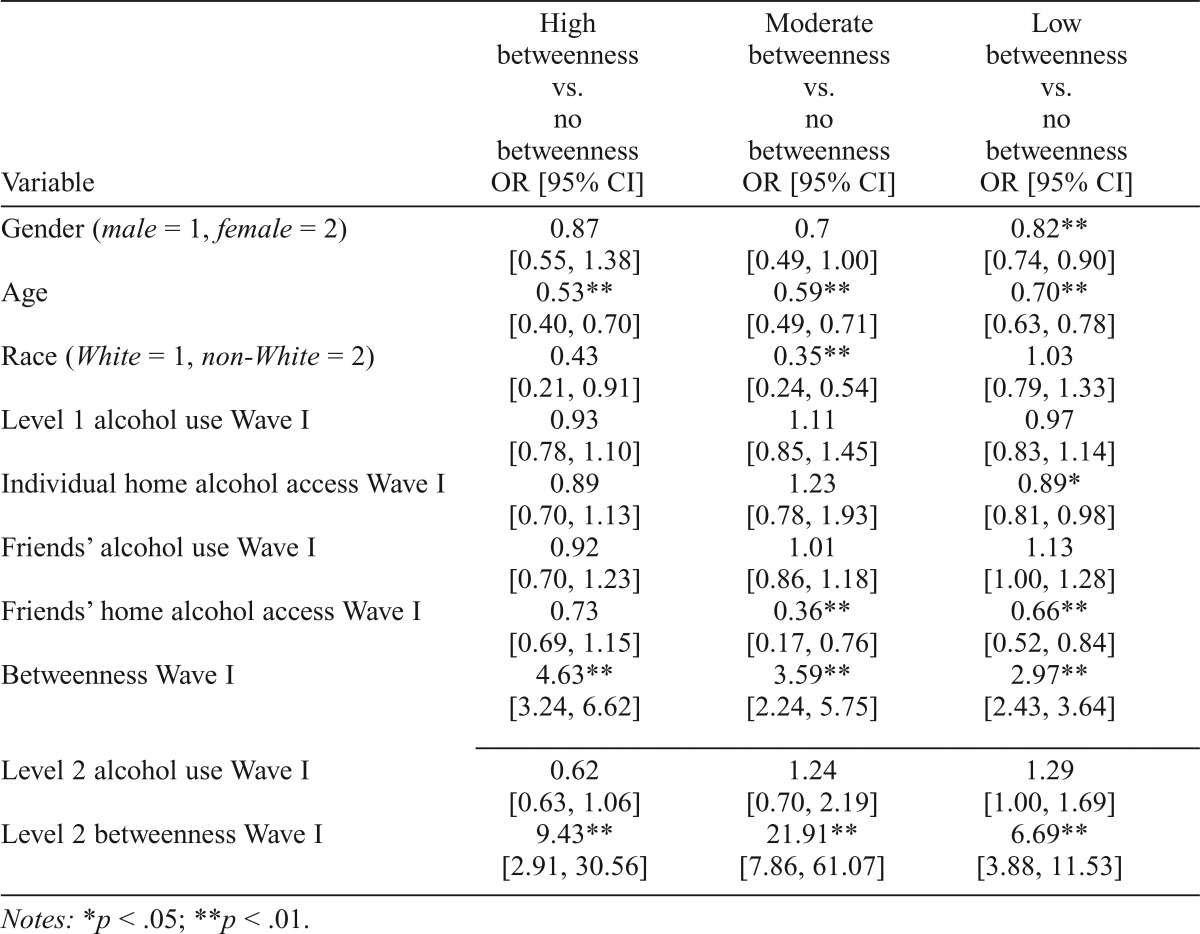
Table 4.
Odds ratios (ORs) for multinomial regression models predicting Wave II betweenness
| Variable | High betweenness vs. no betweenness OR [95% CI] | Moderate betweenness vs. no betweenness OR [95% CI] | Low betweenness vs. no betweenness OR [95% CI] |
| Gender (male = 1, female = 2) | 0.87 | 0.7 | 0.82** |
| [0.55, 1.38] | [0.49, 1.00] | [0.74, 0.90] | |
| Age | 0.53** | 0.59** | 0.70** |
| [0.40, 0.70] | [0.49, 0.71] | [0.63, 0.78] | |
| Race (White = 1, non-White = 2) | 0.43 | 0.35** | 1.03 |
| [0.21, 0.91] | [0.24, 0.54] | [0.79, 1.33] | |
| Level 1 alcohol use Wave I | 0.93 | 1.11 | 0.97 |
| [0.78, 1.10] | [0.85, 1.45] | [0.83, 1.14] | |
| Individual home alcohol access Wave I | 0.89 | 1.23 | 0.89* |
| [0.70, 1.13] | [0.78, 1.93] | [0.81, 0.98] | |
| Friends’ alcohol use Wave I | 0.92 | 1.01 | 1.13 |
| [0.70, 1.23] | [0.86, 1.18] | [1.00, 1.28] | |
| Friends’ home alcohol access Wave I | 0.73 | 0.36** | 0.66** |
| [0.69, 1.15] | [0.17, 0.76] | [0.52, 0.84] | |
| Betweenness Wave I | 4.63** | 3.59** | 2.97** |
| [3.24, 6.62] | [2.24, 5.75] | [2.43, 3.64] | |
| Level 2 alcohol use Wave I | 0.62 | 1.24 | 1.29 |
| [0.63, 1.06] | [0.70, 2.19] | [1.00, 1.69] | |
| Level 2 betweenness Wave I | 9.43** | 21.91** | 6.69** |
| [2.91, 30.56] | [7.86, 61.07] | [3.88, 11.53] |
Notes:
p < .05;
p < .01.

