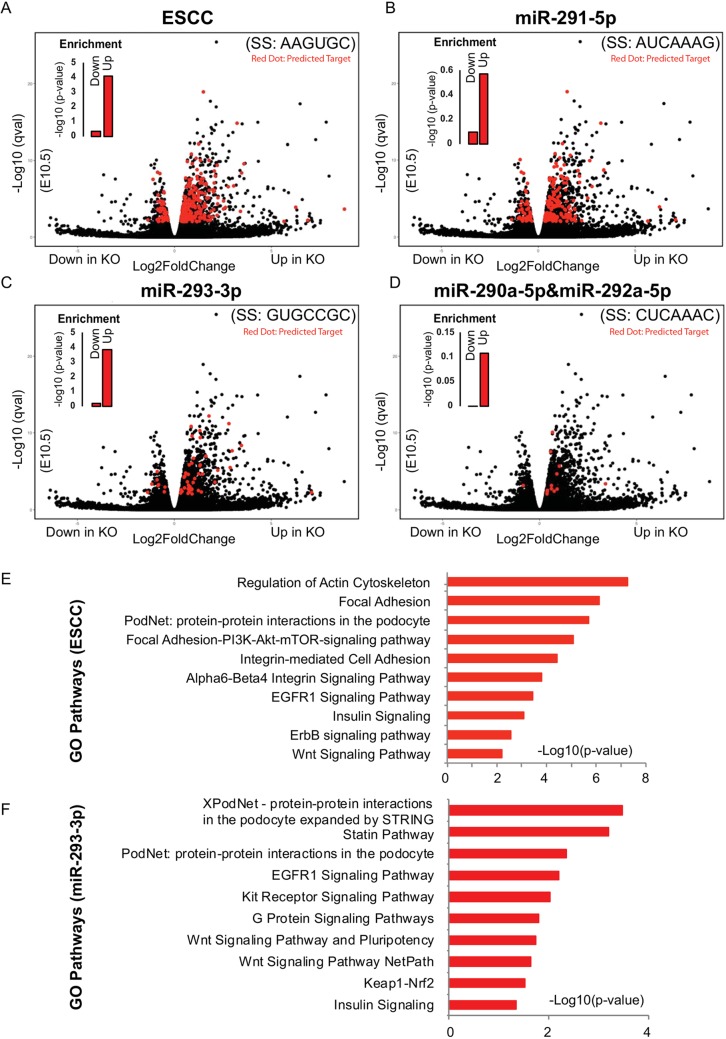
Fig. 6.
Many miR-290 cluster targets are upregulated in the knockout placental labyrinth at E10.5. (A-D) RNA-Seq results. Volcano plots showing fold change and significance values for the four distinct seed families produced by the miR-290 cluster. Targets for each seed family, as predicted by TargetScan, are highlighted in red. Inset bar charts show enrichment P-values for miRNA targets among the upregulated and downregulated genes. (E,F) Top ten GO terms identified by Enrichr for genes that are upregulated and have a seed match to the ESCC (E) or miR-293-3p (F) family. SS, seed sequence; Up, upregulated target; Down, downregulated targets.

