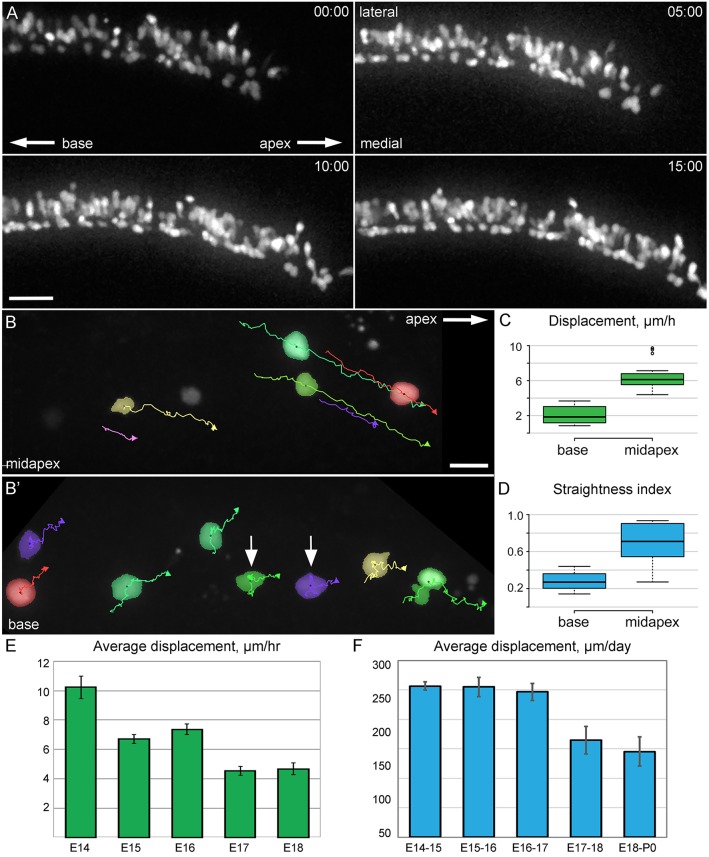
Fig. 2.
OC cells migrate towards the cochlear apex. (A) z-stack projection images from an Atoh1Cre*PR; R26RtdTomato cochlear explant established at E13 and imaged at 2 DIV (E15 equivalent). Indicated time points (h:min) are relative to the beginning of the time-lapse. Lengthening and slight narrowing of the population of labeled cells are apparent as they move in the apical direction. Scale bar: 50 µm. (B) Migration tracks for pseudocolored individual cells from an Atoh1Cre*PR; R26RZsGreen 16 h time-lapse video started at 1 DIV (E14). A single explant was imaged near the mid-apex (B) and at the base (B′) of the cochlea. Cells at the mid-apex move steadily in the apical direction; cells at the base show less consistent migratory paths. Some cells are nearly stationary (arrows). Scale bar: 20 µm. (C) Displacement rates (µm/h) for individual cells located at the mid-apex are significantly greater than those at the base (P<0.001). (D) Average straightness index of cells at apex versus base, indicating that cells in the mid-apex migrate in a straighter line (P<0.001). (C,D) n=3 explants, 18 cells. (E) Average displacement of migrating cells on the indicated embryonic day equivalents, taken from time-lapse sequences of 10-16 h. The rate of cell movement gradually decreases with developmental age. All differences are statistically significant (P<0.01), except E14 versus E16, and E15 versus E16. n=(age, explants, cells): E14, 7, 41; E15, 9, 68; E16, 8, 75; E17, 10, 66; E18, 6, 30. (F) Average displacement of cells per day when imaged once every 24 h. Early (E14-E16) values are all significantly different (P<0.01) from late (E17-P0) values. n=(age, explants, cells): E14, 4, 14; E15, 5, 15; E16, 7, 24; E17, 4, 14; E18, 4, 14. (E,F) Data shown are averages±s.e.m.

