Fig. 4.
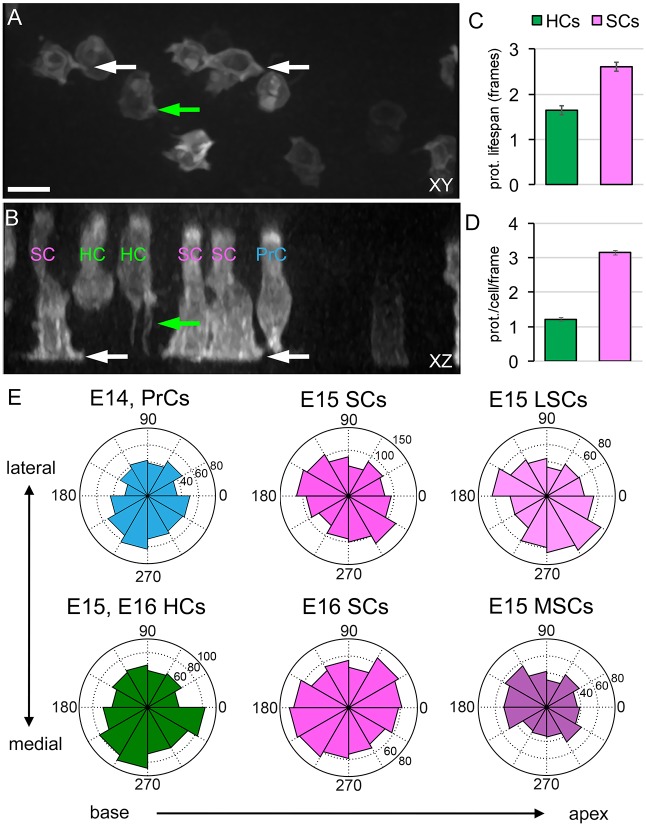
Migrating cochlear epithelial cells generate cellular protrusions. (A,B) Images from a Sox2CreERT2; R26RmT-mG E15 explant, labeled with membrane EGFP. (A) xy (luminal) view; (B) xz (luminal-basal) view. Cellular protrusions are present on both SCs and HCs. SC protrusions extend primarily along the basement membrane (white arrows). HCs generate thin basal projections (green arrows). Putative cell types are labeled in B. Scale bar: 10 µm. See Movie 5. (C) Duration of cellular protrusions in HCs and SCs. The average lifespan of an SC protrusion is longer than that of a similar protrusion in an HC (P<0.001). (D) SCs display nearly three times as many protrusions over time than HCs (P<0.001). (C,D) n=5 explants, 23 cells, 1365 protrusions, 1261 frames (1 cell/frame). (E) Distribution of angles of protrusions in xy, relative to cell centroid, in the indicated cell types at the indicated time points. Analysis of protrusions in PrCs at E14 indicates a non-uniform distribution (P<0.05), with a bias towards the medial side of the epithelium. At E15, SC protrusions also show a non-uniform distribution (P<0.005), skewed 45° towards the axis of extension. Separation of E15 SCs based on position within the developing OC [lateral supporting cells (LSCs) are in the OHC region and medial supporting cells (MSCs) are in the inner hair cell (IHC) region] indicates that the distributions differ (P<0.005), with more protrusions in each region towards the midline. At E16, no bias in the distribution of protrusions was observed in SCs. E15 or E16 HCs did show a bias in protrusions towards the medial side (P<0.005), but these cells do not contact the basement membrane. n=(age, cells, protrusions): E14, 13, 537; E15, 23, 1365; E16, 16, 1239.

