Fig. 5.
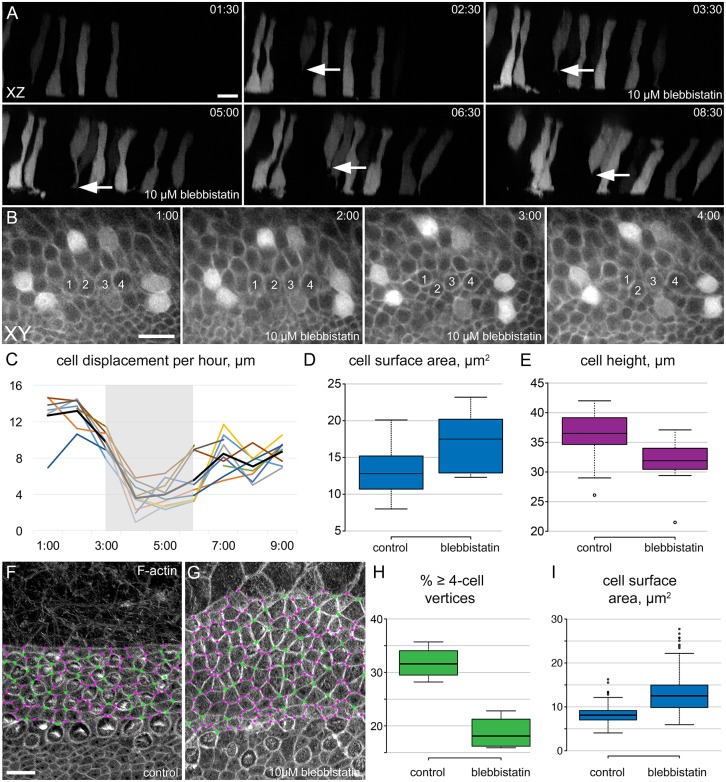
MyoII is required for cell migration and intercalation. (A) xz projections from a time-lapse (Movie 6) of a tdTomato-labeled E15 explant treated with blebbistatin for 3 h. During MyoII inhibition, a presumptive HC extends a basal protrusion (arrows), which retracts when blebbistatin is diluted. Scale bar: 10 µm. (B) Time-lapse images from an Atoh1Cre*PR; R26RtdTomato/mT-mG E16 explant labeled with membrane tdTomato and Cre-induced cytoplasmic tdTomato. Blebbistatin (10 µM) slows cell movement and disrupts cellular organization. Four putative HCs (numbered) become misaligned during MyoII inhibition. See Movie 7. Scale bar: 10 µm. (C) Cell displacement per hour in blebbistatin-treated explants. Each line represents the displacement of a single cell. The gray box indicates the duration of the 10 µM blebbistatin treatment. After 3 h, blebbistatin was diluted to 1 µM, and the rate of cell movement gradually increased. (D) Measurements of luminal surface area of PrCs from time-lapse sequences, showing an increase in surface area before and after 2.5 h of 10 µM blebbistatin treatment (P<0.05). (E) Cell height of the PrCs in D, measured along the z-axis of xz projections, decreases after 2.5 h of MyoII inhibition (P<0.01). (D,E) n=3 explants, 10 cells. (F) Control cochlear explant established at E13 and maintained for 3 DIV, stained with phalloidin. Cell vertices containing three (magenta) or four or more cells (green) are indicated. Scale bar: 10 µm. (G) Similar image as in F from an explant treated with 10 µM blebbistatin, with fewer four-cell vertices. (H) Blebbistatin treatment leads to a decrease in the percentage of vertices containing four or more cells (P<0.001). Number of vertices: 1218, control; 1471, blebbistatin. (I) The luminal surface area of both HCs and SCs increases in response to MyoII inhibition (P<0.001). Number of cells: 133, control; 157, blebbistatin. (H,I) Four explants per condition.

