Fig. 7.
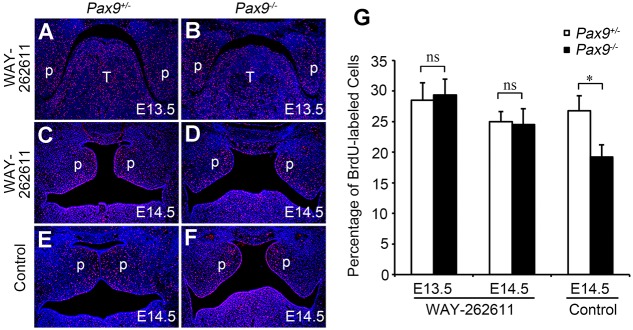
Cell proliferation in the palate of WAY-262611-treated Pax9−/− mice. Representative images of sections through the posterior regions of the palate in E13.5 and E14.5 Pax9+/− (A,C,E) and Pax9−/− (B,D,F) embryos with (A-D) or without (E,F) WAY-262611 treatment. Red signals show the distribution of BrdU-labeled nuclei. Blue signals show total nuclei (Hoechst). T, tongue; p, palate shelf. (G) The percentage of BrdU-labeled cells in the palatal mesenchyme. n=5. Error bars represent s.d. *P<0.01; ns, not significant.

