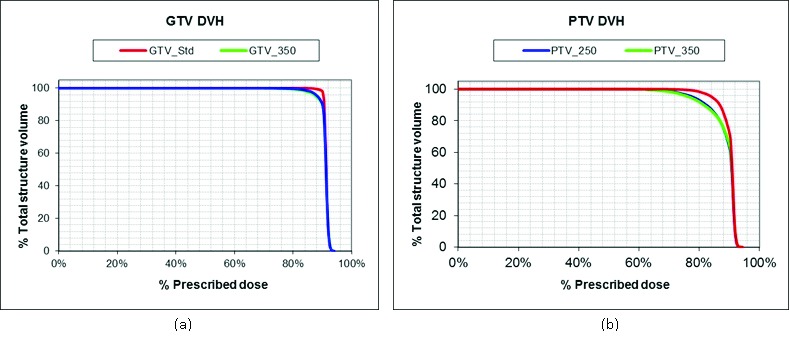
Figure 7.

DVH comparison of FOV volumes. The overlay of dose volume histograms (DVHs) for GTV_std, GTV_250 and GTV_350 (a) and for PTV_std, PTV_250 and PTV_350 (Fig. 5b) for GTV # 7. The difference in DVH represents the dosimetric effect of field of view.
