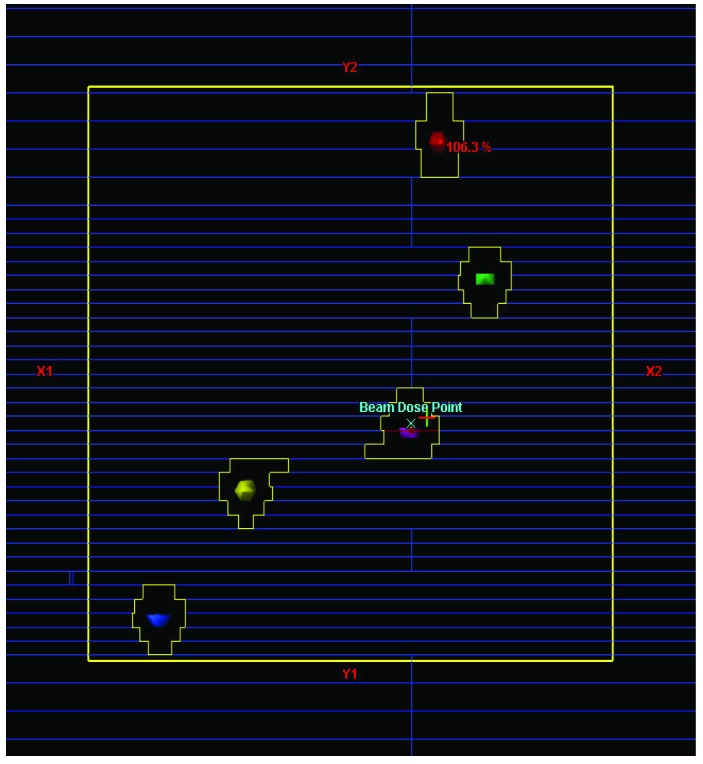
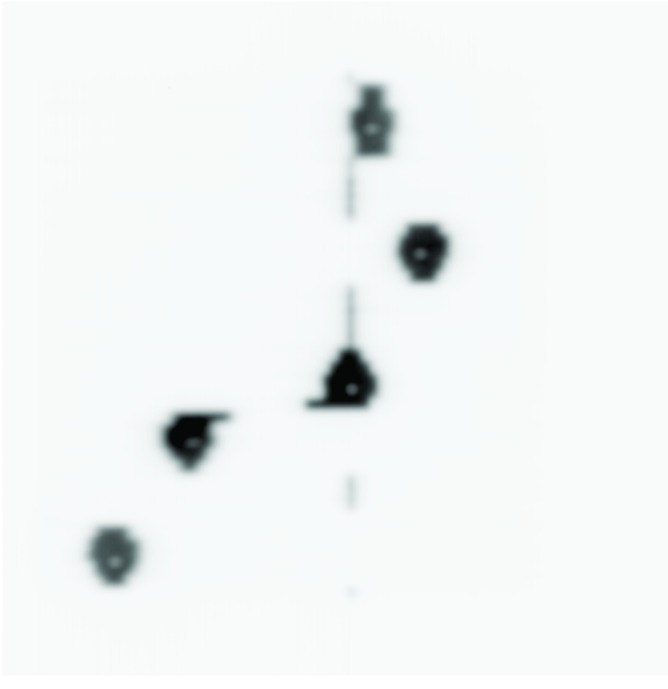
Figure 5.


Snapshots of (a) the treatment plan beam’s eye view image in the Eclipse treatment planning system (each colored sphere in the BEV represents an individual target.) and (b) the portal image acquired from the SRS arc treatment beam deliveries (white small dots within the MLC openings represent the metallic BB markers.) Note that the all the five BBs are well visualized in the portal image.

