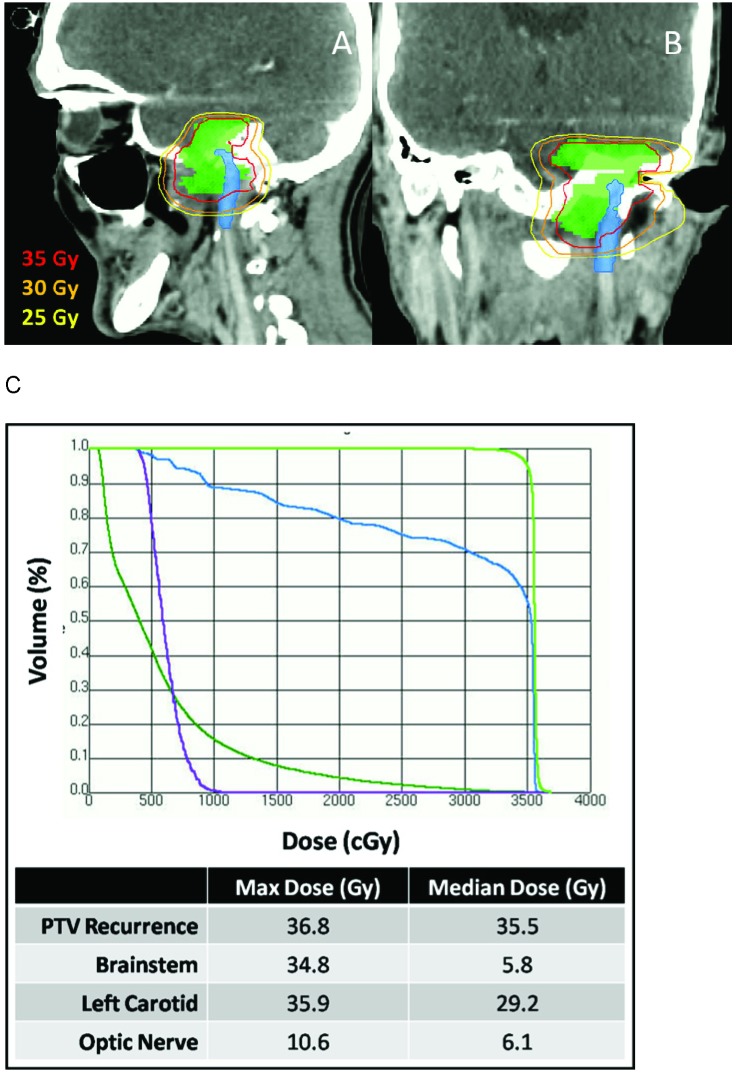
Figure 2.
Sagittal (A) and coronal (B) CT post-contrast images of the SBRT treatment plan are shown with planning target volume (PTV) of the recurrent tumor (light green) and the internal carotid artery (blue). Panel C shows the dose volume histogram for PTV (green), carotid (blue) brainstem (forest green) and optic nerve (purple).

