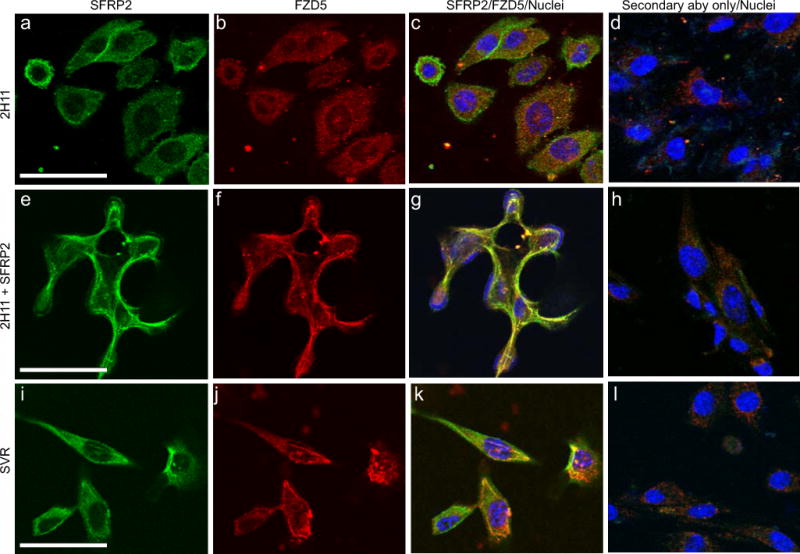
Figure 2. SFRP2 and FZD5 co-localize at the surface of 2H11 and SVR cells.

Fluorescence confocal microscopy was used to detect localization of SFRP2 (A, E, I) and FZD5 (B, F, J) in 2H11 (A–H) and SVR (I–L) cells. 2H11 cells were either untreated (A–D) or treated with 10 nM SFRP2 (E–H) for 1 minute. SFRP2 (green) FZD5 (red) were visualized using an FITC- or AlexaFluor546-labeled secondary antibody, respectively. Nuclei (blue) were identified using Hoeschst 33342. Merged images (C, G, K) showing the co-localization of SFRP2 and FZD5 (yellow) at the surface of SFRP2-treated 2H11 cells (G), at the surface SVR cells which highly express endogenous SFP2 (K), but not at the surface of untreated 2H11 cells (C). Controls were treated with secondary antibody only, with the primary antibody omitted (D, H, I). Scale bar in A, E and I represents 30μm.
