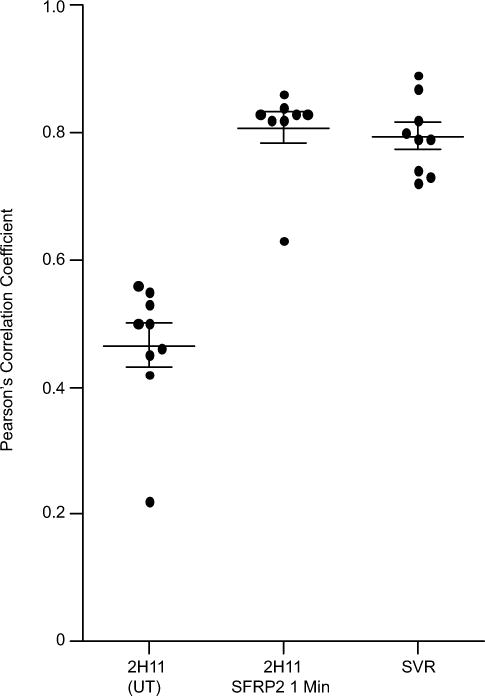
Figure 3. Intracellular colocalization analysis of SFRP2 and FZD5 in 2H11 and SVR cells.

The vertical scatter plot shows individual Pearson’s correlation coefficients with the mean of the coefficients and standard error of the mean (n = 9 cells from at least four fields for all samples). Analysis indicates that in 2H11 cells, a pool of SFRP2 and FZD5 colocalize. This phenomenon is rapidly amplified by the addition of exogenous SFRP2 and reaches the levels of colocalization observed in SVR cells, which express sustained endogenous levels of SFRP2. Difference between 2H11 control and 2H11 exposed for one minute to exogenous rhSFPR2 was significant (two tailed t-test; p = 0.0003).
