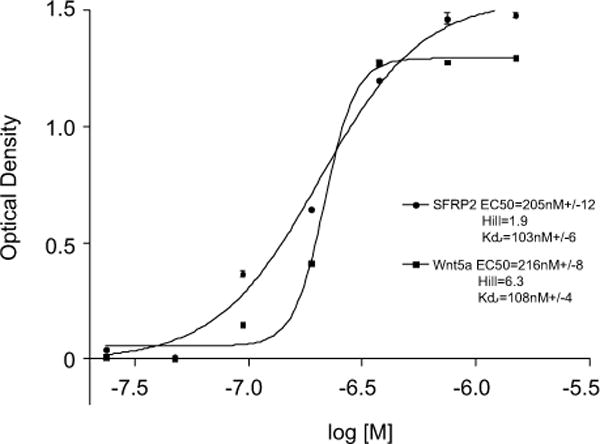
Figure 5. SFRP2 and Wnt5a bind FZD5.

Graphic representation of rhSFRP2 and rhWnt5a binding to FZD5-Fc showing changes in 450 nm optical density (OD450) as a function of the log of ligand concentrations. To do this, A microplate solid phase protein binding assay was performed using a concentration range of his-tagged recombinant human SFRP2 and Wnt5a from 24nM – 1500nM (x axis). The experiment was repeated twice for a total of n = 6. Kd, EC50 and Hill coefficient were calculated and compared for SFRP2 and Wnt5a binding to FZD5.
