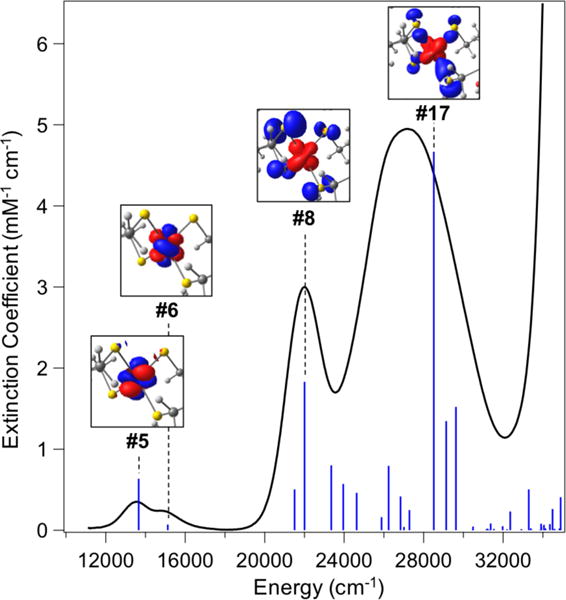
Figure 3.

Optical absorption spectrum (black) of NiIIRd overlaid with TD-DFT-calculated optical transitions for the full model of NiIIRd (blue sticks). (Inset) Electron difference densities for the dominant transitions in the visible and near-UV region of the spectrum; blue lobes reflect loss of electron density, while red lobes reflect increased electron density in the transition. Difference density figures are labeled according to the energy-ordered number of that transition.
