
Figure 7.
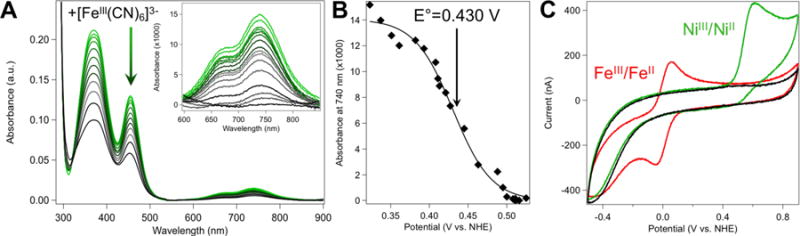
(A) Representative absorbance spectra showing the potentiometric titration of NiIIRd with potassium ferricyanide (40 μM NiRd, 50 mM Tris-buffer, pH 8.0; spectra shown reflect up to 1 equiv. ferricyanide added). (B) Absorbance of NiRd at 740 nm as increasing amounts of ferricyanide are added (50 mM Tris, pH 8.0). The line shown represents a least-squares fit of the data to the Nernst equation (E° = 0.430 V vs. NHE). (C) Cyclic voltammogram of NiRd (green), FeRd (red) and the blank glassy carbon electrode (black) in 100 mM KCl, 50 mM acetate buffer, pH 4.5 (ν = 10 mV/s).