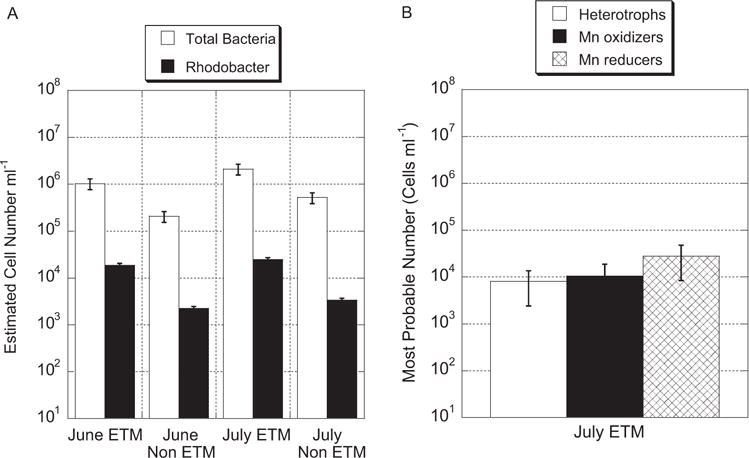
Fig. 4.

A. Real-time qPCR quantification of 16S rRNA gene copy number of total Bacteria and Rhodobacter spp. in Columbia River estuary samples during both ETM and non-ETM events. The y-axis represents the 16S rRNA gene copy number normalized by three rRNA operon copies as an estimate of cell number (see Experimental procedures and Fogel et al., 1999). Data represent an average of triplicate samples and bars represent standard error.
B. Most probable number (MPN) counts for heterotrophic bacteria, Mn-oxidizing bacteria (including Rhodobacter sp.) averaged across all carbon substrates, and for Mn-reducing bacteria (including Shewanella sp.) for samples taken in July 2007. Data represent an average of quadruplicate samples and bars represent the upper and lower 95% confidence intervals.
