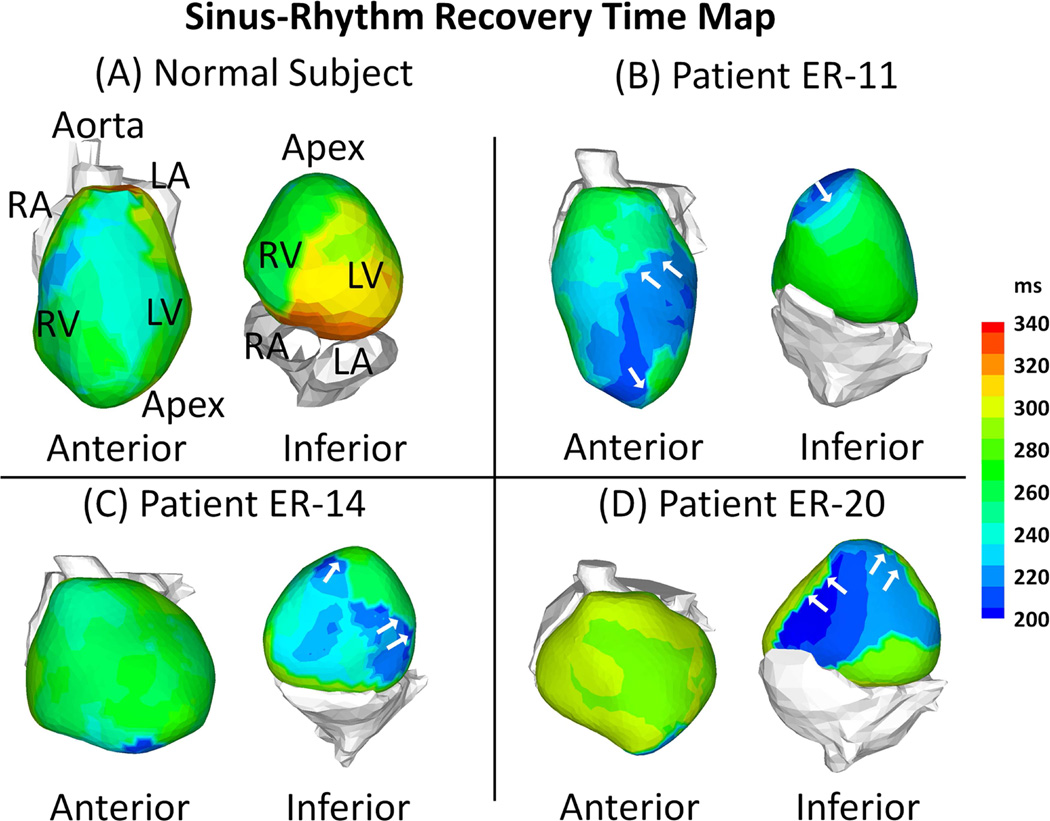
Figure 3. Recovery Time (RT) Maps.
Examples of epicardial RT during SR are shown for a normal control subject and 3 ERS patients. Maps are shown in anterior view and inferior view for each subject. ERS patients have regions with abnormally short RT (dark blue). White arrows in Panels B-C point to regions with steep RT gradients.

