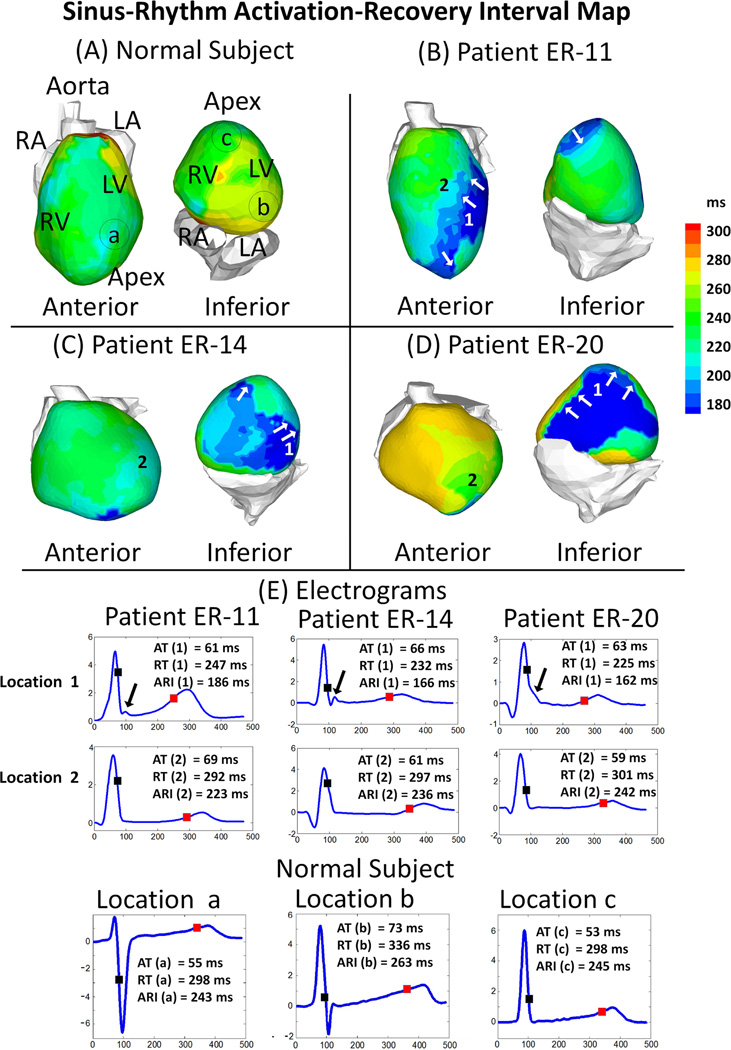
Figure 4. Activation-recovery Interval (ARI) Maps.
Panels A to D: ARI maps for a normal control subject and 3 ERS patients. Maps are shown in anterior view and inferior view for each subject. ERS patients have regions with abnormally short ARI (dark blue). White arrows in Panels B-C point to regions with steep ARI gradients. Top two rows of Panel E show ECGI reconstructed electrograms (EGMs) from two adjacent location in each ERS patient. Location 1 (top row): prominent J-wave and short ARI; location 2 (middle row): absence of J-wave and normal ARI. There is a steep gradient of repolarization across these two locations. Bottom row of Panel E shows 3 EGMs from the normal subject, from locations marked in Panel A. The time instances of activation (AT; black square), recovery (RT; red square) and corresponding ARIs are indicated.

