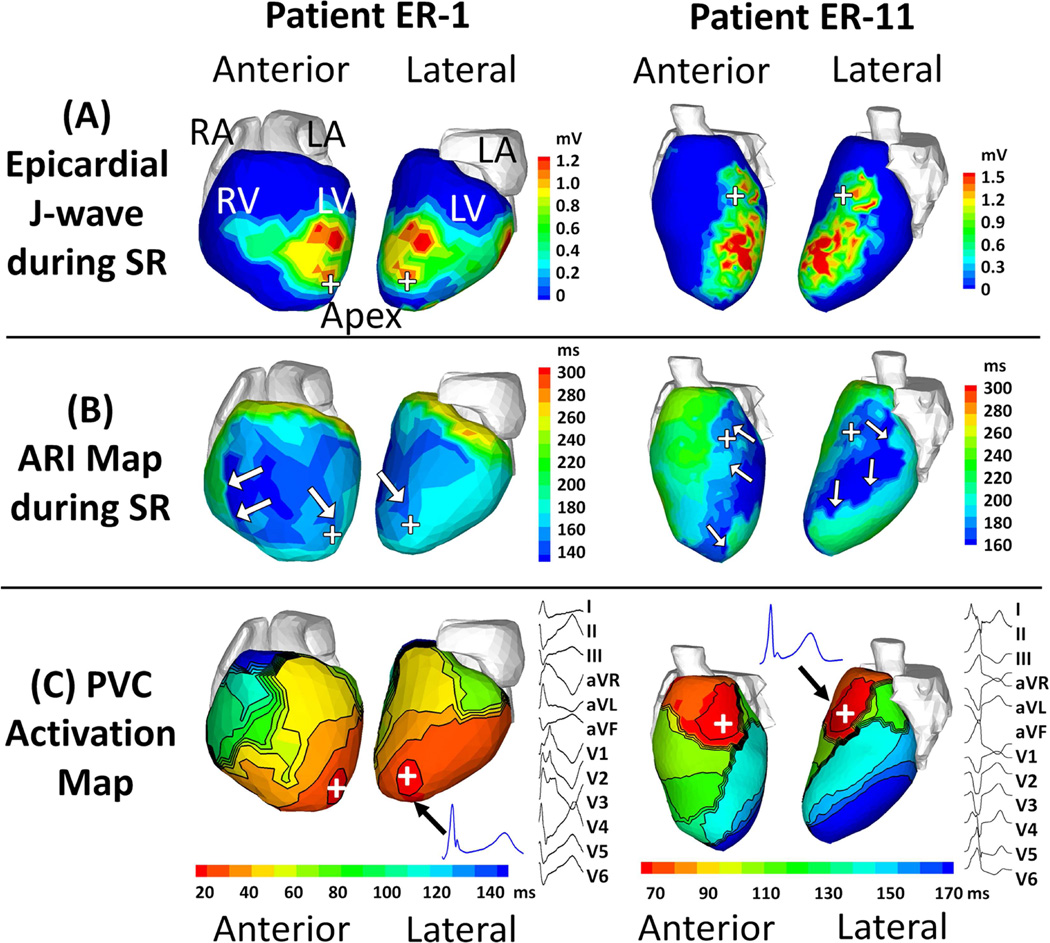
Figure 5. The electrophysiological substrate in relation to premature ventricular contractions (PVCs).
(A) Epicardial J-wave magnitude and (B) Activation-recovery interval (ARI) maps during sinus rhythm (SR). (C) PVC activation map and 12-lead ECG. Each panel shows maps for 2 patients, ER-1 (left, PVC coupling interval =635 ms) and ER-11 (right, PVC coupling interval = 520 ms). The hearts are displayed in anterior and lateral views. White arrows in Panels B point to regions with steep ARI gradients. In panel C, J-wave electrograms (EGMs) from the PVC site of origin are shown (black arrow); 12-lead ECG depicting the PVC is shown to the right of the map. The PVC initiation sites are indicated by plus signs “+”. Note that an EP substrate with abnormal EGMs, shortened ARIs and steep ARI gradients correlated with the PVC site of origin in both cases.

