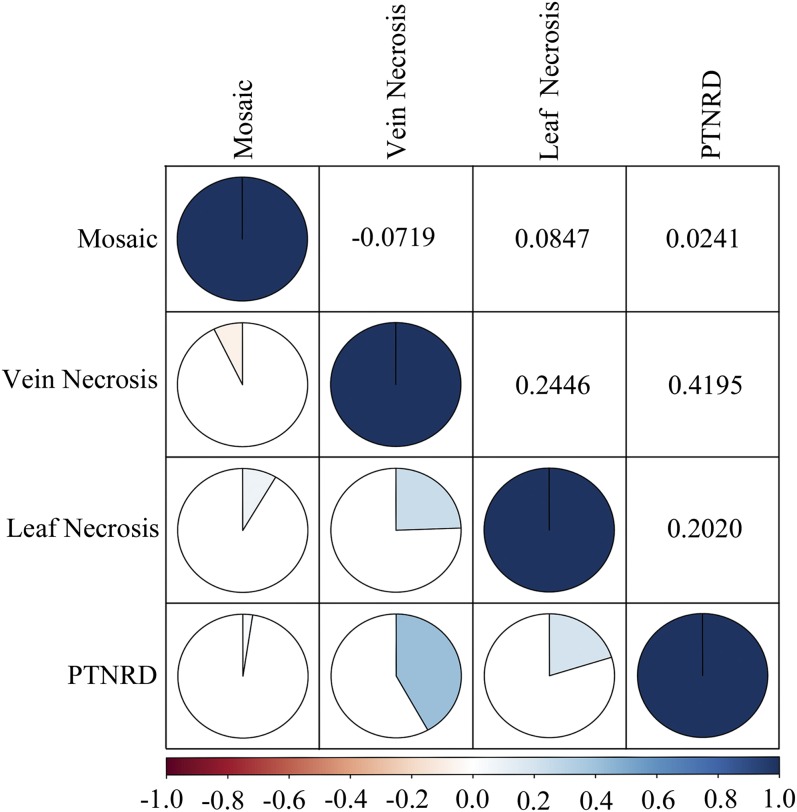
Figure 4.
Pairwise correlation analyses using the nonparametric Kendall’s τ rank correlation coefficient to measure the strength of the relationship between each type of symptom expression. Positive correlations are displayed in blue and negative correlations in red. Color intensity is proportional to the correlation coefficients. Potato tuber necrotic ringspot disease, PTNRD.

