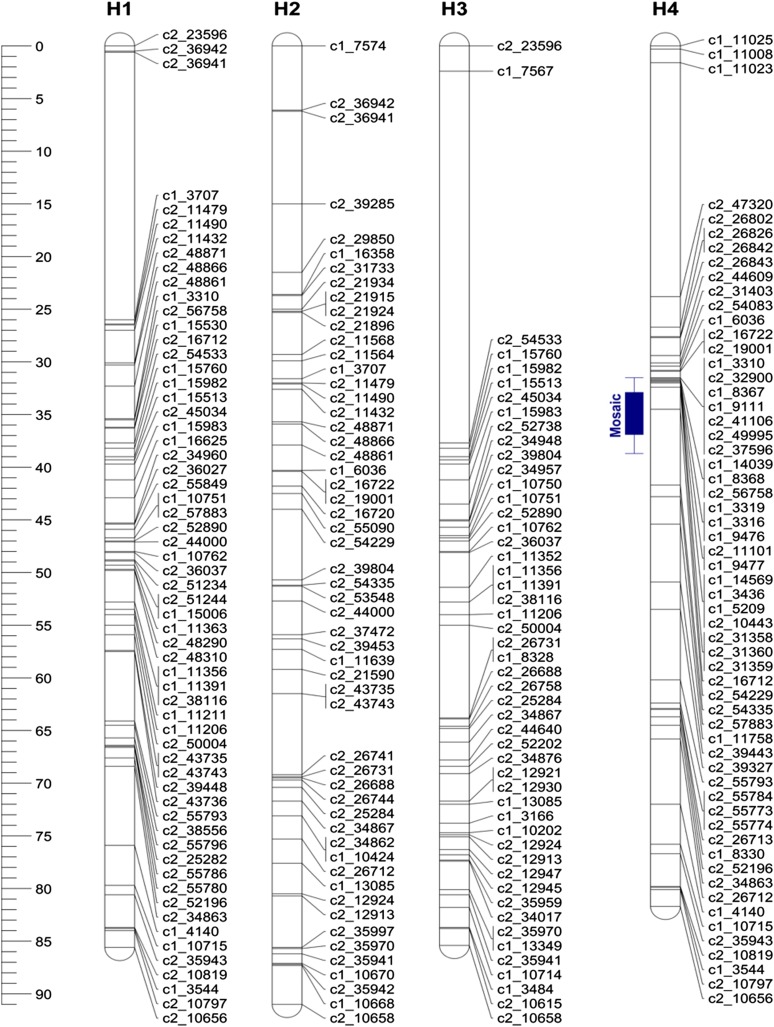
Figure 6.
Linkage map of Waneta chromosome 4 (H1–H4 = homologous maps). The blue bar corresponds to the 95% support LOD interval for the QTL location for lea mosaic. Whiskers represent the two LOD support interval and the solid box represents the one LOD support interval for the QTL location. LOD, logarithm of the odds; QTL, quantitative trait loci.

