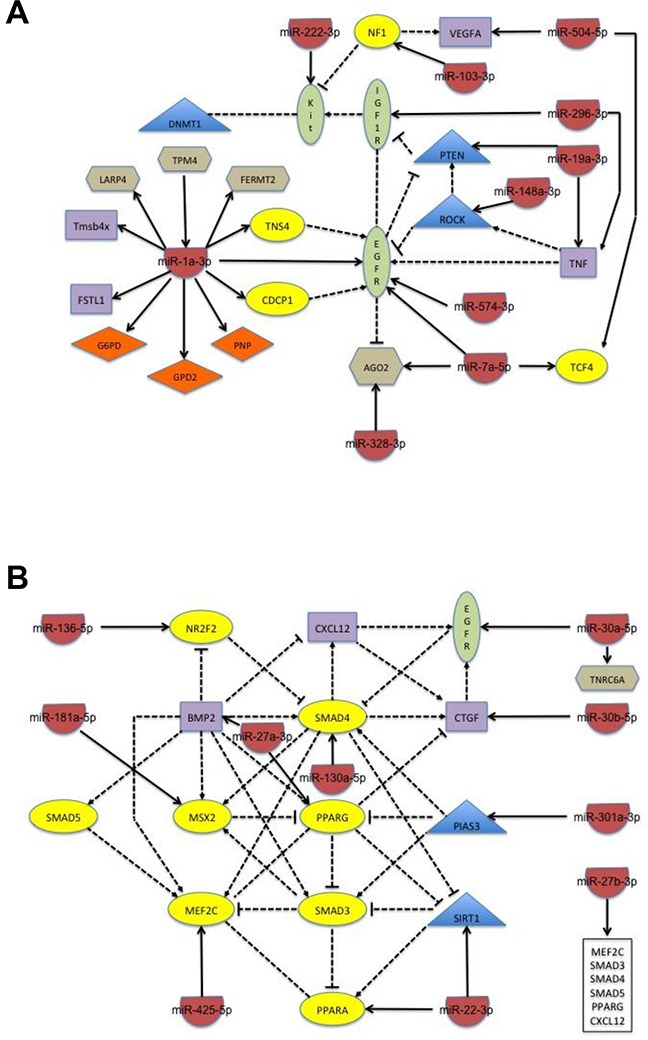
Figure 4. Schematic of the network of biological interactions between miRNA and their target genes whose change in expression is seen only in cells stably expressing PAX3-FOXO1.

Schematics are separated into groups according to how changes occur during the first 24 hours of differentiation. (A) Increased expression at 30 minutes with subsequent increase or decrease at 24 hours of differentiation; and (B) decreased expression at 30 minutes with subsequent increase or decrease at 24 hours of differentiation. The target genes are classified by color and shape according to their known biological function: yellow oval – transcription factor; blue diamond – enzyme; purple rectangle – ligand; green oval – receptor; orange tetrahedron – transporter; blue triangle – proliferative regulator; and brown hexagon – miscellaneous function. The solid line indicates the direct regulation of the expression of a target gene by the miRNA and the dotted line indicates a physical interaction between target genes, with both types of interactions being supported through literature evidence.
