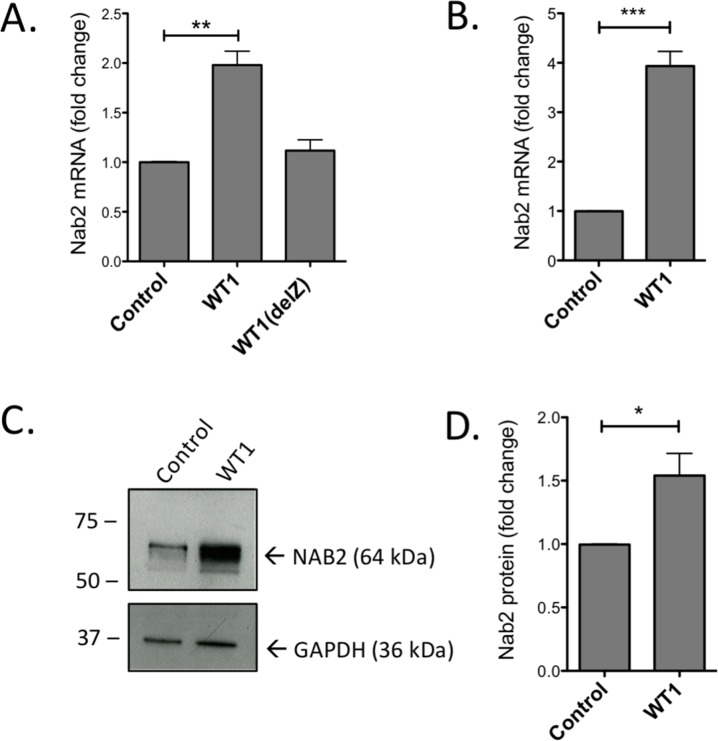
Figure 1. Overexpression of WT1 induces increase of NAB2 mRNA and protein.
CD34+ progenitor cells or U937 cells were retrovirally transduced with a vector encoding full length WT1+/− isoform (WT1), WT1 lacking zinc fingers (WT1(delZ)), or with empty vector (Control). After transduction and sorting for GFP+ cells, RNA and protein were extracted and analyzed by qPCR and immunoblotting, respectively. Shown are relative levels of NAB2 mRNA in CD34+ cells (A) and in U937 cells (B), immunoblotting of NAB2 protein in U937 cells (C), and protein levels, as determined by densitometry (D). Mean values, bars ±S.E.M., n = 3. Stars indicate statistical significance (*: p < 0.05; **: p < 0.01; ***: p < 0.001).

