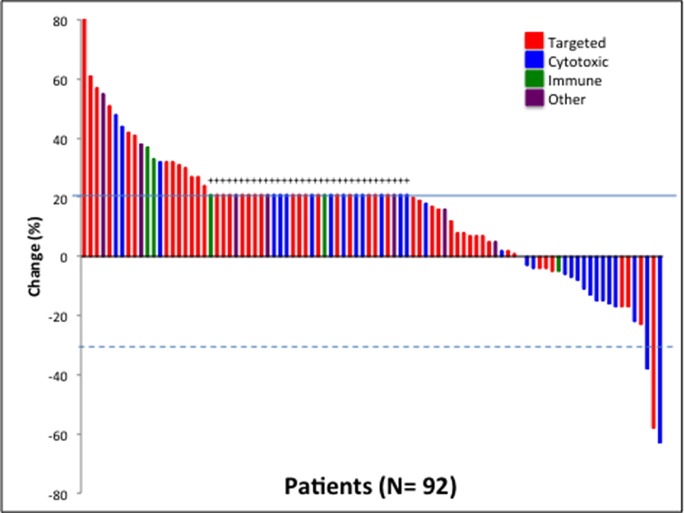
Figure 1. Waterfall plot depicting best RECIST response by patient.
Individual patients are represented by vertical bars on the X-axis. The best RECIST response (%) is depicted on the Y-axis. Ninety-two of the 95 patients had response measurable by RECIST. Thirty-three patients were assigned a value of +21% (progressive disease) because of clinical progression or new lesions (+). Solid line shows 20% progression by RECIST. Dotted line shows 30% response by RECIST.

