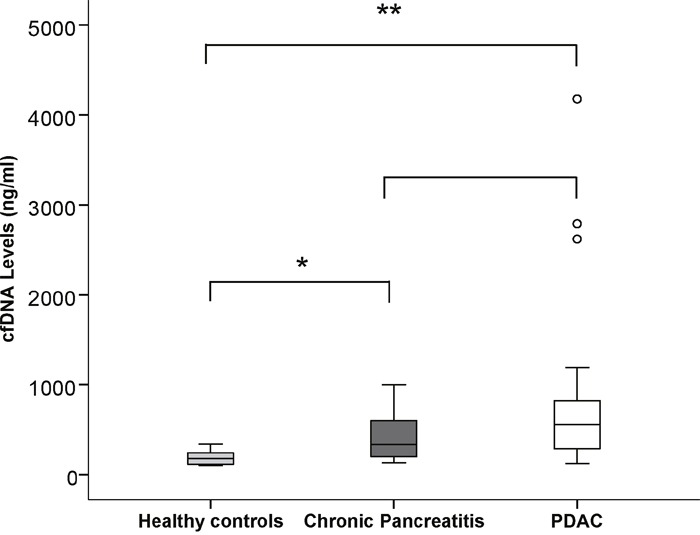
Figure 1. Stem and Leaf plot demonstrating the differences in cfDNA levels between healthy controls, CP and PDAC patients.

A significantly higher expression was noted in CP patients compared to healthy controls and in PDAC patients compared to healthy controls but not between CP patients and PDAC. * p<0.05, ** p<0.001.
