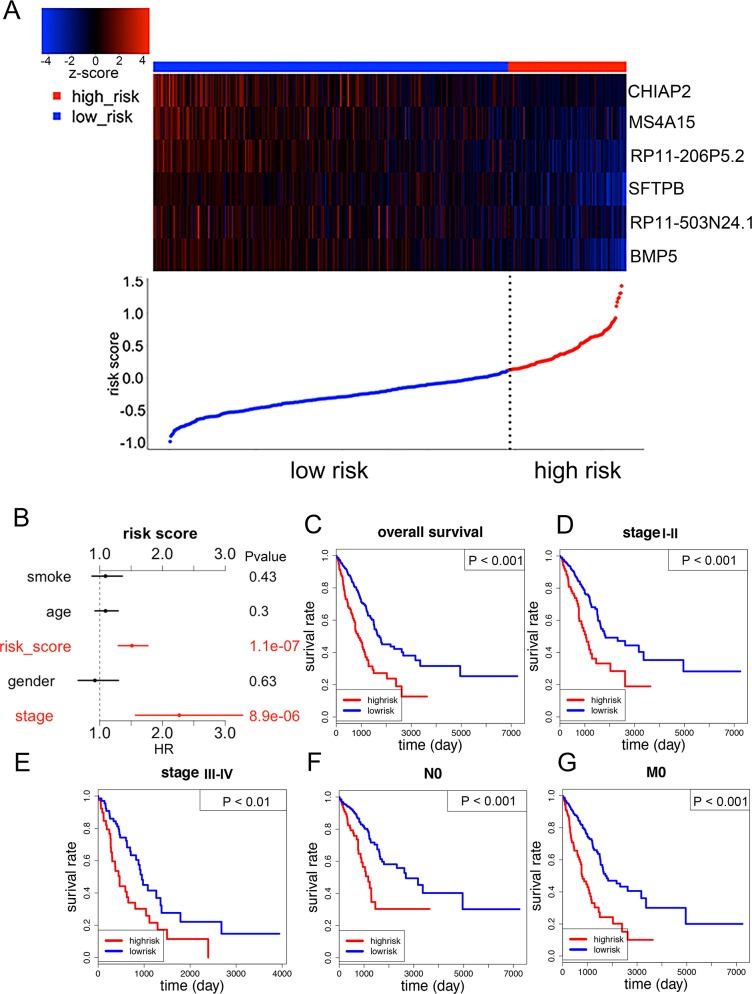
Figure 8. The six-gene signature predicted overall survival of patients with LUAD.
(A) The six genes’ expression and risk score distribution, with red indicating higher expression and blue indicating lower expression. The risk scores for all patients in LUAD were plotted in ascending order and marked as low risk (blue) or high risk (red). (B) Multivariate Cox regression analysis showing the risk score of the six-gene signature can serve as an independent prognostic factor in LUAD. (C) The Kaplan-Meier curves for all LUAD patients stratified by six-gene signature in high and low risk. (D-G) Kaplan-Meier curves of overall survival in the stage I-II, stage III-IV, N0 and M0 cohort stratified by six-gene signature in high and low risk.

