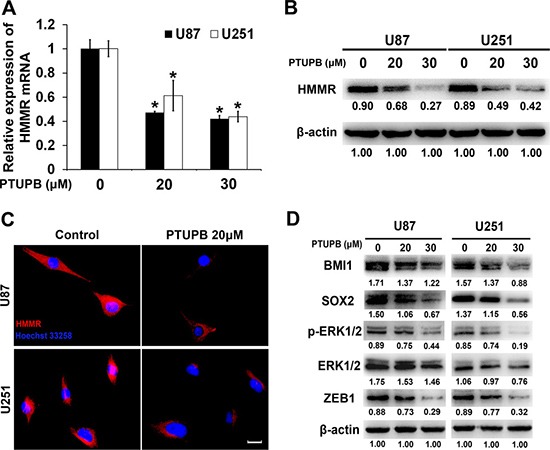
Figure 4. PTUPB suppresses expression of HMMR and stemness markers and regulators.

(A) Quantitative real time-PCR assay showed that HMMR mRNA level is reduced by PTUPB (*P < 0.05). The western blot assay (B) or cellular immunofluorescence (C) Scale bar = 10 μm) showed that HMMR protein level is significantly reduced by PTUPB. (D) The western blot assay showed that PTUPB suppresses the expression of BMI1, SOX2 and ZEB1 and the activation of ERK1/2. β-actin was used as a loading control. The immunoblotting bands were quantified by ImageJ and represented by relative values compare with loading control (1.00).
