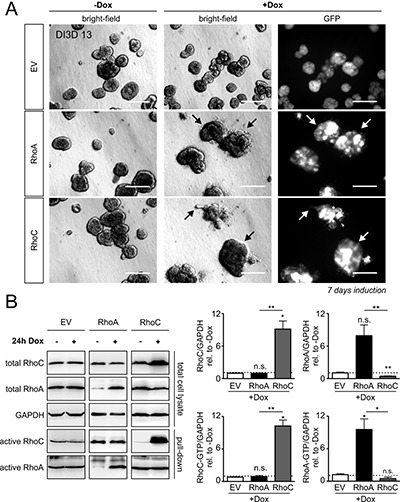
Figure 3. Doxycycline-inducible overexpression of RhoA and RhoC in MCF-10A cells.

(A) MCF-10A cells were transfected with solely GFP (EV, top), RhoA plus GFP (RhoA, middle) or RhoC plus GFP (RhoC, bottom) -containing constructs under the control of the tet-ON promoter. The transgenic MCF-10A cell lines were left untreated or were stimulated for GFP/Rho expression by addition of Doxycycline (+Dox), DI3D 7-13. GFP-expression is shown in all three induced transgenic cell lines (right). There was no GFP expression detectable in non-induced cells; scale bar 50 μm. (B) Typical Western-blots determining the expression levels of total and active RhoA and RhoC proteins in GFP-, RhoA- and RhoC-expressing MCF-10A cells (left). Quantification of total RhoC (top left), active RhoC-GTP (bottom left), total RhoA (top right) and active RhoA-GTP (bottom right) after 24 h of gene induction. Protein levels were normalized to the reference protein GAPDH and are given relative to non-induced control cells. The shown western blot results of RhoA, RhoC and EV induction are derived from different gels as indicated by the black framing. Note that RhoC overexpression significantly suppresses total RhoA levels. Bars and error bars represent mean (N = 3) ± SEM. *p < 0.05; **p < 0.01; ***p < 0.001; n.s., p ≥ 0.05; two-tailed, one-sample t-test.
