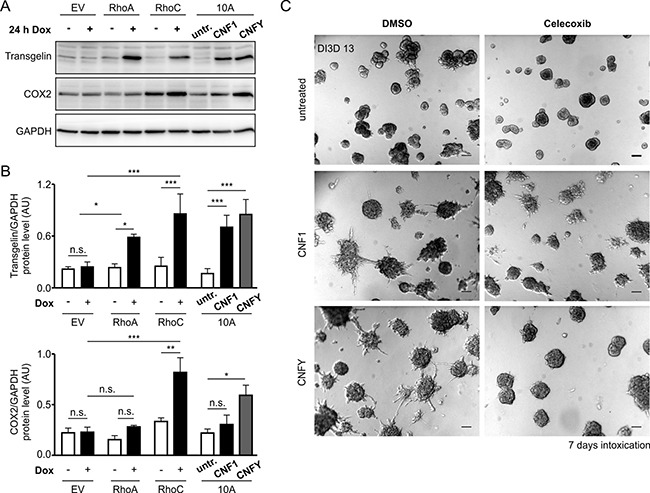
Figure 6. Transgelin and COX-2 as target genes of Rho proteins and CNF toxins.

(A) Western-blots showing the expression levels of Transgelin and COX-2 as putative candidate target genes of RhoA/C and CNF1/Y. Protein levels were determined in GFP-, RhoA- and RhoC-inducible MCF-10A cells ± Doxycycline induction over 24 h (left) and in WT-MCF-10A cells with or without treatment with 1 nM CNF1 or CNFY over 24 h (right). (B) Average protein expression levels (N = 3) in the different cell lines and treatments as described in (A) for Transgelin (top) and COX-2 (bottom) normalized to GAPDH. (C) Representative phase-contrast micrographs of untreated (top), CNF1- (middle) and CNFY-treated (bottom) MCF-10A 3D cultures, which were additionally treated with the specific pharmacological COX-2 inhibitor (20 μM Celecoxib, right) or DMSO (left) as a control (pictures taken at DI3D 13, CNF1/Y treatment DI3D 7-13, DMSO/Celecoxib treatment DI3D 7-13), scale bar 50 μm. Bars and error bars represent mean ± SEM. *p < 0.05; **p < 0.01; ***p < 0.001; n.s., p ≥ 0.05.
