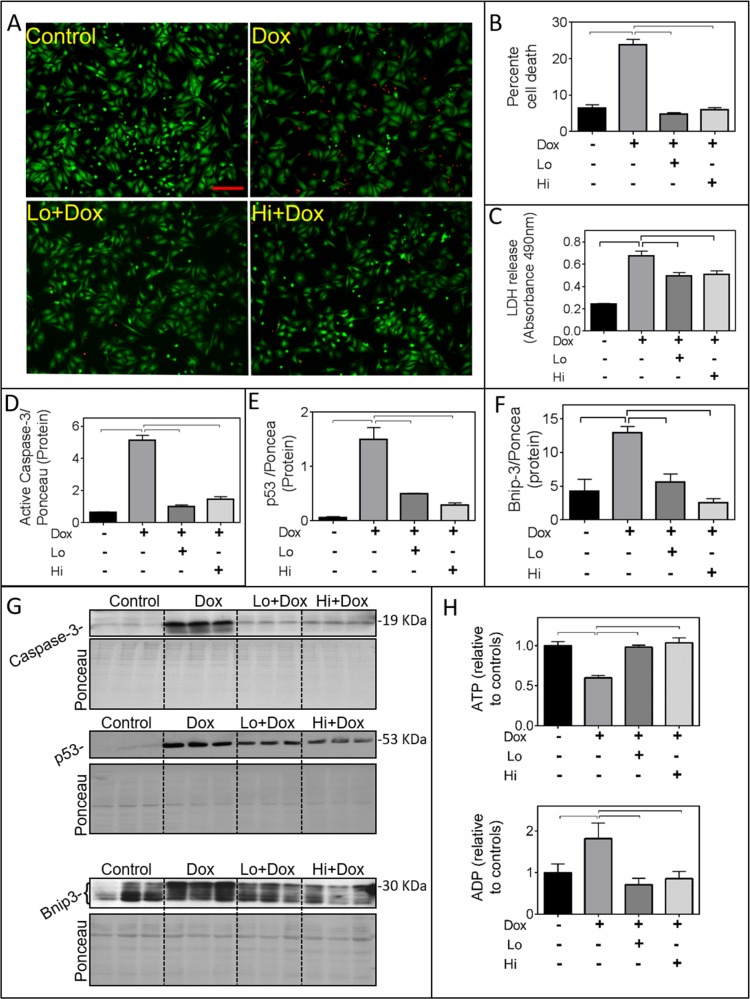
Figure 1. FGF-2 isoforms prevent Doxorubicin-induced toxicity in cardiomyocytes.
Panels A-H show the effects of Doxorubicin (Dox) exposure for 24 hours in the presence and absence of Lo- or Hi-FGF-2 pre-incubation, as indicated. (A) and (B) show, respectively, representative images of myocytes stained with the Live-Dead assay: Calcein-AM (green, live cells) / Ethidium homodimer (red, dead cells), and the corresponding graph with the percentage of cell death in attached cells. (C) LDH released in culture medium, assessed by Absorbance at 490 nm (n=6). (D), (E), (F) show, respectively, relative protein levels of cleaved (active) caspase-3 (19 kDa), p53 (53 kDa), and Bnip-3 (~30 kDa). Data for the graphs were obtained from the corresponding western blots shown in panel (G); images of the same membranes stained for Ponceau S are also included, and served to adjust for minor variations in protein loading. (H) ATP and ADP levels relative to controls, as indicated (n=6). Data is plotted as mean ± SEM and statistically significant differences are shown by brackets between groups; a P<0.05 was considered significant.

