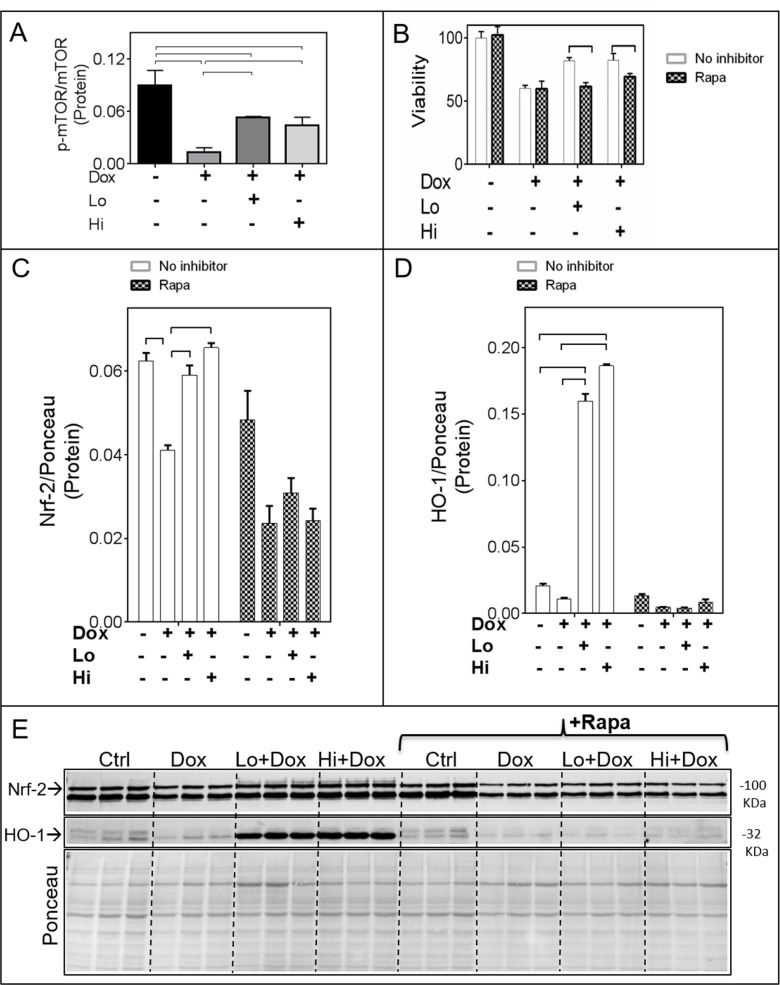
Figure 5. The mTOR pathway mediates the FGF-2 induced effects on Nrf-2 and HO-1.
Panel (A) Relative levels of active (phospho-Ser2448 mTOR)/total mTOR (n=4). The corresponding western blot is shown in Supplementary Figure 4A. (B) Cardiomyocyte viability as estimated by the Calcein-AM (fluorescence intensity) assay, in the absence (empty columns) or presence (shaded columns) of Rapamycin, Dox, and FGF-2 isoforms (n=8), as indicated. (C) and (D). Relative protein levels for, respectively, Nrf-2 and HO-1 in the absence (empty columns) or presence (shaded columns) of Rapamycin (n=3). Data is plotted as mean ± SEM and statistical differences are shown by brackets where significant P<0.05. The corresponding western blot is shown in Panel (E).

