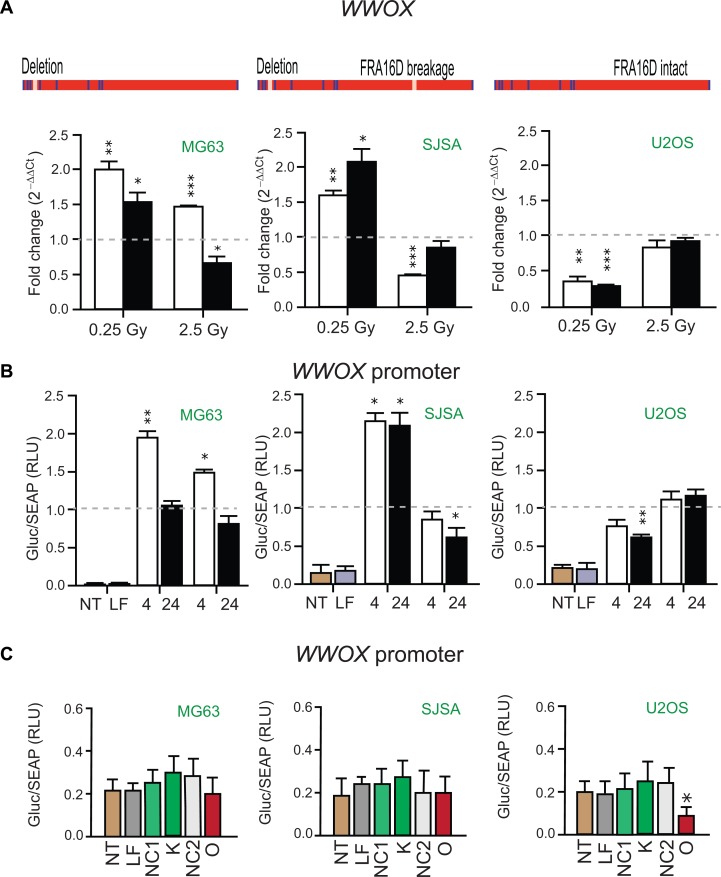
Figure 3. WWOX transcript levels and promoter activity in Osteosarcoma cell lines.
(A) Schematics of the WWOX gene in MG63, SJSA and U2OS with presence or absence of intron 3 deletion or FRA16D breakage indicated (above). Histograms of WWOX expression in these cell lines 4 hr (white bars) or 24 hr (black bars) post 0.25 or 2.5 Gy irradiation exposure. Values were normalized with TATA-binding protein (TBP) encoding the endogenous gene with relative expression comparison to sham-irradiated (0 Gy) equivalent cells (dashed lines). Data are represented as mean ± SEM (n = 3) with significance represented by asterisks (p < 0.05) where appropriate. (B) Histograms of Gaussia luciferase (GLuc) activity normalized to alkaline phosphatase activity (SEAP) indicative of WWOX promoter activity in MG63, SJSA and U2OS. Tissue culture media analyzed 4 hr and 24 hr following 0.25 Gy or 2.5 Gy cellular irradiation or sham irradiation (dashed line). Data are represented as mean ± SEM (n = 3). (C) Histograms of GLuc activity normalized to SEAP in non-transfected (NT), lipofectamine transfected (LF), PARTICLE knockdown (K), PARTICLE overexpression (O), siRNA negative control (NC1) or in vitro transcript control (NC2) in MG63, SJSA and U2OS. Data are represented as mean ± SEM (n = 3).

