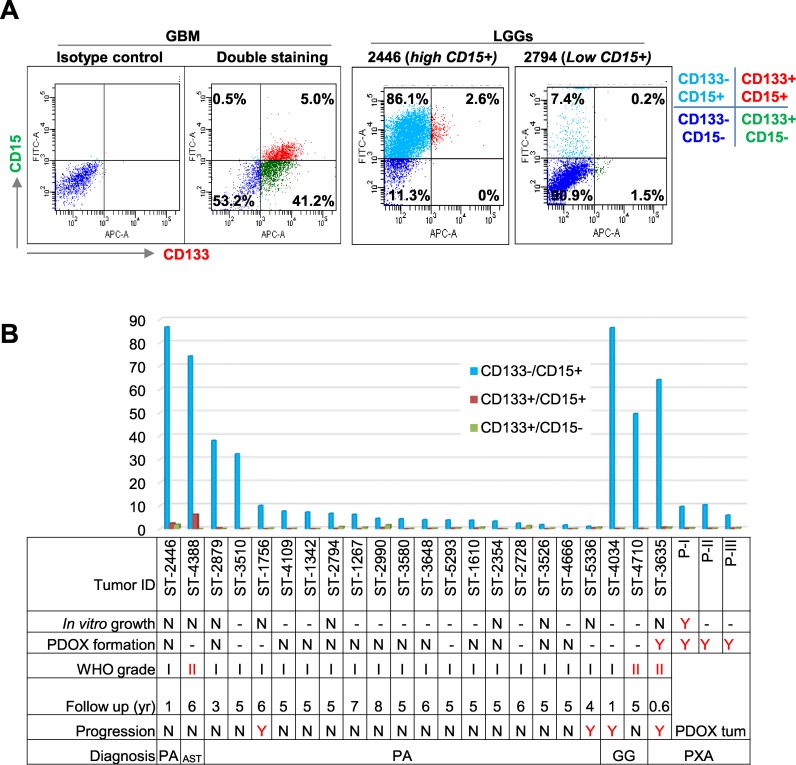
Figure 2. Analysis of CD133+ and CD15+ cells.
(A) Representative graph showing successful double staining of CD133 and CD15 in GBM (left 2 panels) and PLGGs with high (middle panel) and low (right panel) CD15+ cells. (B) Summary graph showing relative abundance of mono- and dual-positive (CD133 and CD15) cells related to tumor cell growth, PDOX formation, pathological grade, years of follow up, and status of progression. Due to limited viable tumor cell yields, not all samples were tested with all assays. “-”: not tested; N = did not grow/no progression, Y = grew in culture or in vivo or progressed.

