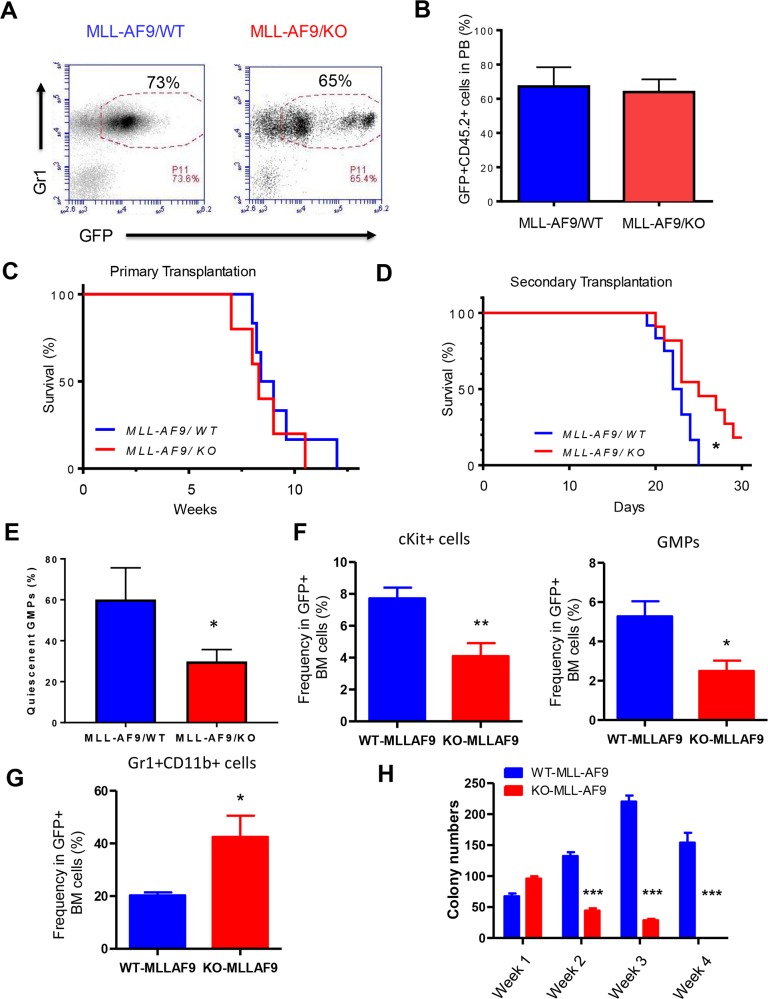
Figure 2. Necdin deficiency delays the progression of leukemia-induced by MLL-AF9.
(A) Primary transplantation of fetal liver cells expressing MLL-AF9. Representative flow cytometry plots show the frequency of GFP+Gr1+ cells in the peripheral blood of recipient mice 4 weeks following transplantation. (B) The frequency of donor-derived cells (CD45.2+GFP+) in the peripheral blood (PB) of recipient mice was determined by flow cytometry analysis (p=0.2, n=5). (C) Survival curve of animals transplanted with wild type or Necdin null fetal liver cells expressing MLL-AF9 (p=0.2, n=5). (D) Bone marrow cells isolated from primary recipient mice were transplanted into lethally irradiated recipient mice. Survival curve of recipient mice transplanted with WT or Necdin null leukemia cells expressing MLL-AF9 (*p<0.05, n=7). (E) The quiescence of GMPs in the BM of leukemia mice were determined by Ki67 and DAPI staining. Quiescent cells are defined as Ki67− cells (*p<0.05, n=3). (F) The frequency of Kit+ cells and GMPs in the BM of leukemia mice was determined by flow cytometry analysis (*p<0.05, **p<0.01, n=5). (G) The frequency of myeloid cells (Gr1+CD11b+) in the BM of leukemia mice was determined by flow cytometry analysis (*p<0.05, n=5). (H) Necdin null GMPs expressing MLL-AF9 show decreased replating potential compared to wild type leukemia cells (***p<0.001, n=3).

